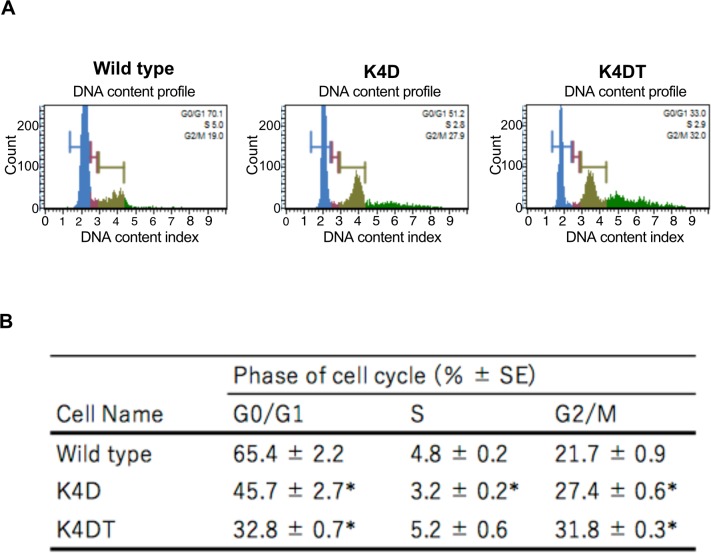
Fig 5. Cell cycle analysis of wild type, K4D, K4DT cells.
(A) Cell cycle histogram of representative results obtained from wild type, K4D, and K4DT cells using the Muse Cell Cycle kit and the Muse Cell Analyzer. (B) The representative data of each experimental group were listed. Data are presented as the mean ± standard error of the ratio of each cell cycle stage (n = 6). We used the Steel-Dwass method. *p < 0.05, **p < 0.01.

