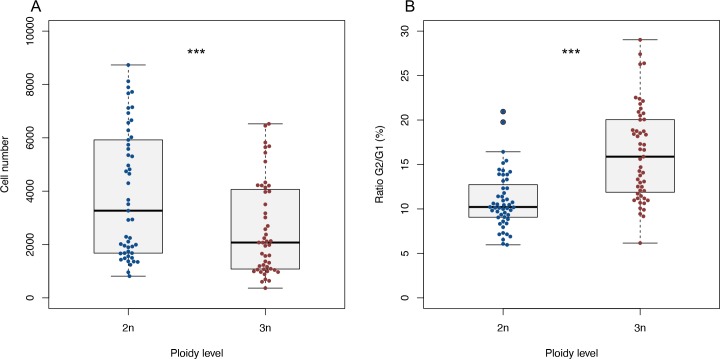
Fig 2. Cell count and G2/G1 ratio of diploid and triploid larvae.
A) Cell number of diploid and triploid larvae in pooled FCM samples. Paired t-test, *** p < 0.001, n = 50. B) Ratio of cells in G1 and G2 phase, calculated as G2/G1*100 for each diploid and triploid larva. Welch’s t-test, *** p < 0.001, n = 50.

