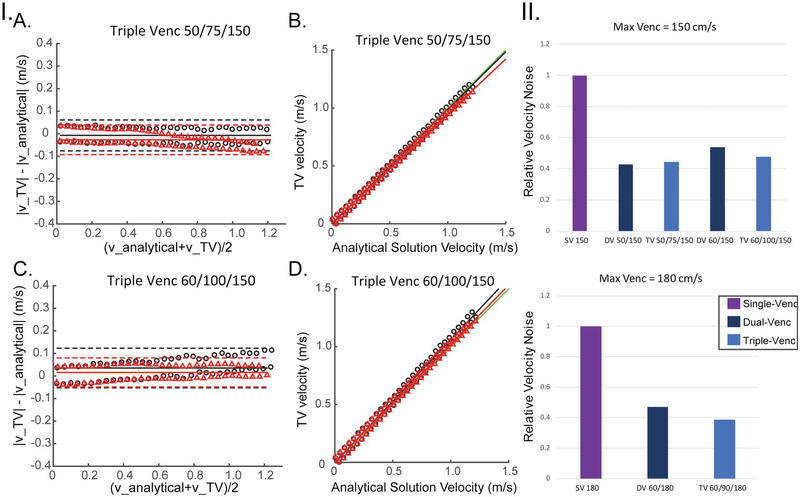
FIGURE 5.
I, Rotation phantom Bland-Altman (A,C) and correlation (B,D) analysis results of the absolute velocity for unwrapped triple-VENC (TV) 50/75/150 and 60/100/150 data using the triconditional algorithm. Red triangles represent the x-velocities plotted along a vertical line, and black circles represent the y-velocities. Red and black lines represent the lines calculated by orthogonal regression for x and y velocities, respectively. Green lines represent a line with slope of 1 (perfect correlation). II, Noise analysis for all 3 sets of VENCs relative to a single-VENC scan corresponding to the iVENC. Noise values are normalized to the separate single-VENC scan noise values. A, experiments using a maximum VENC of 150 cm/s. B, Experiments using a maximum VENC of 180 cm/s

