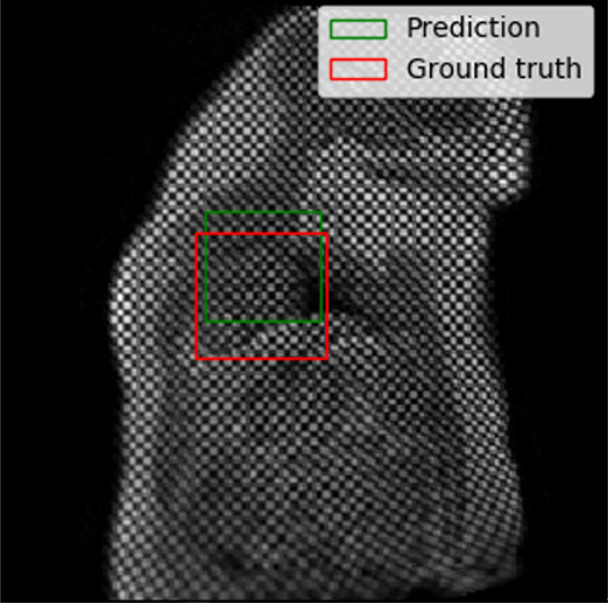
Figure 4a:

Example results from the localization network. (a) Intersection over union (IoU) of 53% and (b) IoU of 63% are the worst prediction results within the test set. (c, d) Typical prediction results. (e) Histogram shows the distribution of accuracy (IoU) throughout the test set.
