. 2020 Mar 2;9:e51035. doi: 10.7554/eLife.51035

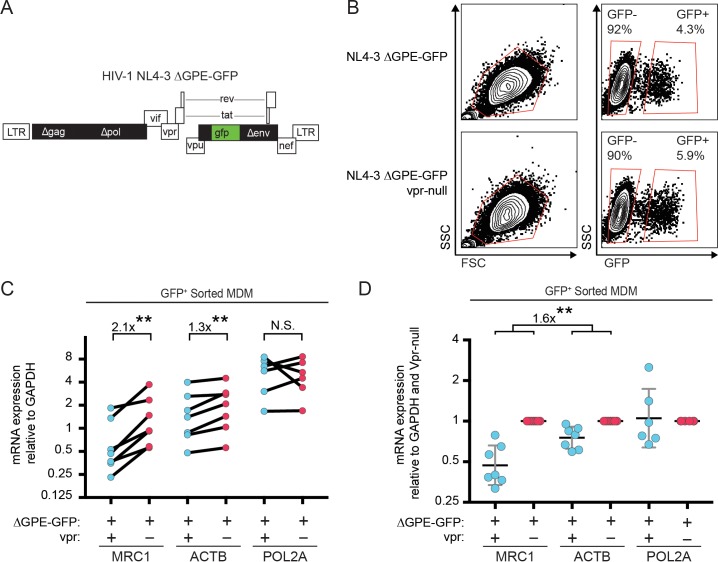
Figure 3. Vpr reduces transcription of MRC1.

(A) Diagram of HIV NL4-3 ∆GPE-GFP. (B) Flow cytometry plots indicating the gating strategy used to sort live GFP+ vs GFP- cells for subsequent qPCR analysis. (C) Summary graph of mannose receptor (MRC1), β-actin (ACTB) and RNA Polymerase 2A (POL2A) mRNA expression in MDM transduced with the indicated HIV reporter and sorted for GFP expression by FACS. All data are normalized to GAPDH mRNA expression. (D) Summary graph of MRC1, ACTB and POL2A expression normalized to the Vpr-null condition in each donor. (n = 7 independent donors). Geometric mean +/- geometric standard deviation is shown. Statistical significance was determined by a two-tailed, ratio t-test. N.S. = not significant p=0.81, **p<0.01.

Figure 3.

Figure 3—figure supplement 1. Vpr reduces transcription of MRC1.

Figure 3—figure supplement 1.

(A) Summary graph of mannose receptor (MRC1), RNA Polymerase 2A (POL2A) and GAPDH mRNA expression in MDM transduced with Vpr-competent or Vpr-null HIV NL4-3 ∆GPE-GFP and sorted for GFP expression by FACS. All data are normalized to ACTB mRNA expression. (B) Summary graph of same data as A normalized to the Vpr+ condition in each donor. (n = 8 independent donors). Geometric mean is indicated by the line. (C) Summary graph of MRC1, ACTB and POL2A mRNA expression in untransduced MDM and MDM transduced with Vpr-competent HIV NL4-3 ∆GPE-GFP. All data are normalized to GAPDH. (D) Summary graph of MRC1, POL2A and GAPDH mRNA expression in untransduced MDM and MDM transduced with Vpr-competent HIV NL4-3 ∆GPE-GFP. All data are normalized to ACTB. (E) Summary graph of MRC1, ACTB and POL2A mRNA expression in untransduced MDM and MDM transduced with Vpr-null HIV NL4-3 ∆GPE-GFP. All data are normalized to GAPDH. (F) Summary graph of MRC1, POL2A and GAPDH mRNA expression in untransduced MDM and MDM transduced with Vpr-null HIV NL4-3 ∆GPE-GFP. All data are normalized to ACTB. Statistical significance was determined by a two-tailed, ratio t-test. N.S. = not significant, **p<0.01, ****p<0.0001.