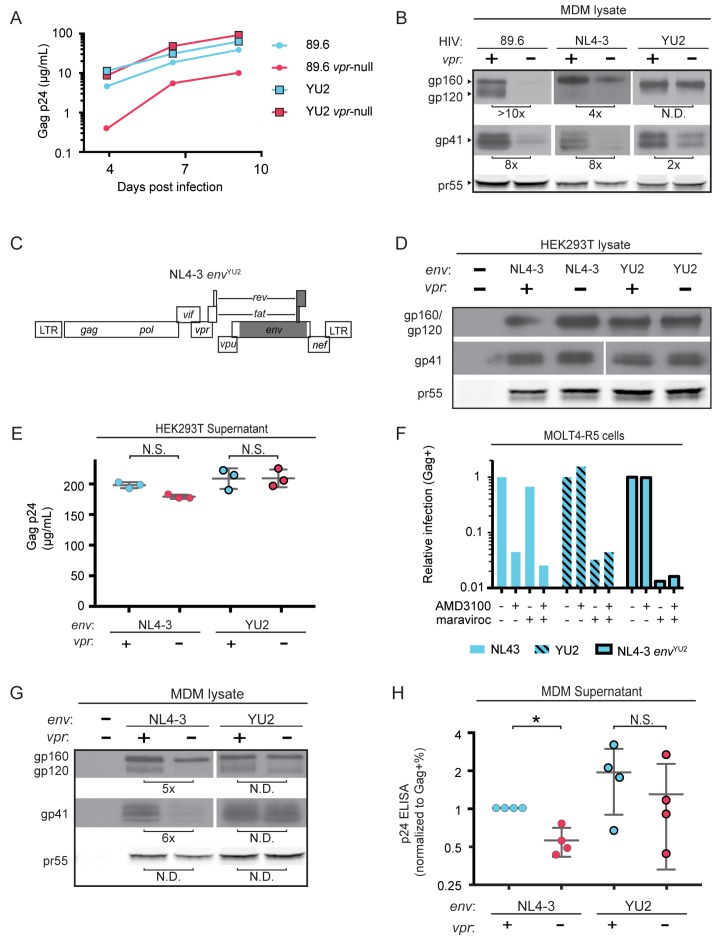
Figure 5. HIV YU2, which lacks a mannose-rich patch, does not require Vpr for robust Env protein expression and spread in MDM.
(A) Virion release over time by primary human MDM infected with the indicated HIV as measured by ELISA (n = 2 independent donors). (B) Western blot analysis of whole cell lysates from MDM infected for 10 days with the indicated HIV. Because NL4-3 infects MDM poorly, NL4-3 was pseudotyped with a YU-2 Env expression plasmid co-transfected in the producer cells as described in Methods. Subsequent spread was blocked in all samples by the addition of entry inhibitors AMD3100 and maraviroc initially added 48 hr post-infection and maintained throughout the culture period. (C) Diagram of the HIV NL4-3 genome. The shaded portion represents the sequence that was replaced with sequence from HIV YU2 to create the NL4-3 envYU-2 chimera. (D) Western blot analysis of 293T cells transfected with the indicated HIV constructs. YU-2 gp41 is detected by the monoclonal antibody z13e1 and NL4-3 gp41 is detected by the monoclonal antibody CHESSIE-8. (E) Virion release from 293T transfected as in D as measured by p24 ELISA. (n = 3 experimental replicates). (F) Relative infection of MOLT4-R5 cells 48 hr after inoculation with the indicated viruses and treatment with entry inhibitors as indicated. The frequency of infected cells was measured by intracellular Gag stain and normalized to the untreated condition for each infection. (G) Western blot analysis of primary human MDM infected for 10 days with the indicated virus as in B. (n = 2 independent donors). (H) Summary graph showing virion release as measured by p24 ELISA from primary human MDM infected as in G. Virus production was adjusted for infection frequency as determined flow cytometrically using an intracellular Gag stain. The mean +/- standard deviation is shown. (n = 4 independent donors). N.D. – no difference. Statistical significance was determined using a two-tailed, ratio t-test. N.S. – not significant, *p<0.05.


