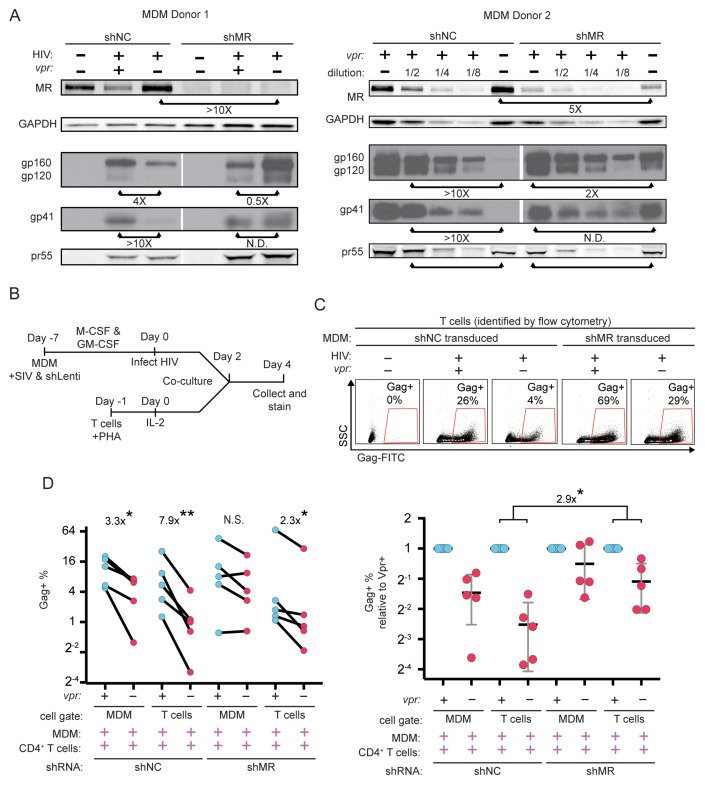
Figure 7. Knockdown of MR enhances Env expression and spread to T cells in vpr-null infection of MDM.
(A) Western blot analysis of MDM from two independent donors treated with the indicated silencing vector and infected with the indicated HIV for 10 days. The shRNA sequences encoded by the negative control vector (shNC) and the MR silencing vector (shMR) are described in Methods. (B) Schematic diagram of experimental protocol used for silencing experiments. (C) Representative flow cytometric plots showing frequency of infected (Gag+) primary T cells following two days of co-culture with autologous, HIV 89.6 infected primary MDM. T cells were identified in co-culture by gating on CD3+ CD14- cells as shown in Figure 7—figure supplement 1B. (D) Summary graph displaying relative infection of MDM and T cells as measured in C (n = 5 independent donors). Data in the left panel are unnormalized. In the right panel the data have been normalized to the wild-type condition for each donor and shRNA.


