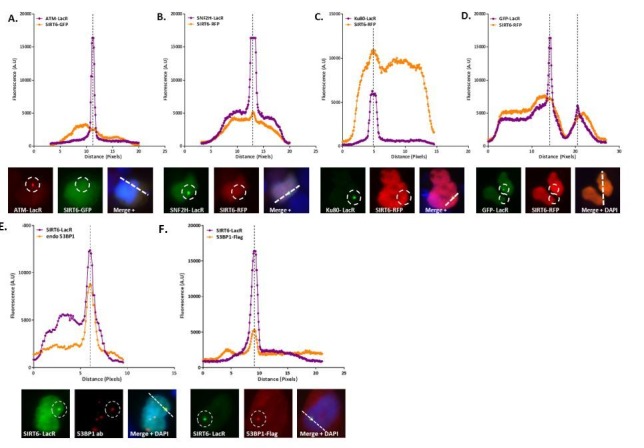
Author response image 4. Co-localization analysis.

(A) LacR-ATM with SIRT6-GFP: Both are nuclear proteins that are usually found evenly spread across the entire nucleus. While we can see a sharp peak where the ATM-LacR focus is located, we do not see a peak of SIRT6-GFP at the same cellular location, which means there is no co-localization of the two proteins in this image. (B) LacR-SNF2H with SIRT6-RFP: A clear peak in the graph of the SNF2H-LacR is accompanied by a clear peak of the SIRT6-RFP, meaning positive co-localization. Since the red signal is much weaker than the green, the SIRT6 peak is much smaller than the SNF2H one. (C) LacR-Ku80 with SIRT6-RFP: In this case the SIRT6-RFP signal is much stronger that the Ku80-LacR GFP signal; however, we can still observe clear peaks at the same location. (D) LacR-GFP with SIRT6-RFP: In this negative control condition, there are no parallel peaks in the graph. However, when looking at the merged image we see that both cells are”yellow”. This just means that both signals are equally as strong (as can be seen in the graph as well) and that both proteins are spread throughout the entire nucleus; however, this is not a co-localization. (E-F) LacR-SIRT6 with 53BP1: When comparing endogenous 53BP1 (E) to the exogenous (F), we can see that using an endogenous antibody usually gives a “cleaner” higher peak with less background; however, in both cases the co-localization is clear.
