
Table 3.
DFT Calculations on L8 and L8•CuCl2a
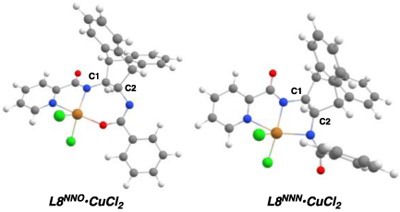 | |||||
|---|---|---|---|---|---|
| entry | ligand binding mode |
Egas phase (kcal/mol) |
Esolvent corrected (kcal/mol)c |
τ4’C1 | τ4’C2 |
| with CuCl2 | |||||
| 1 | L8NNO•CuCl2 | 0 | 0 | 0.93 | 0.95 |
| 2 | L8NNN•CuCl2 | 22.5 | 19.5 | 0.86 | 0.85 |
| without CuCl2b | |||||
| 3 | relaxed L82− | 0 | 0 | 0.96 | 0.97 |
| 4 | L8NNO | 18.7 | 13.6 | 0.93 | 0.95 |
| 5 | L8NNN | 39.5 | 30.0 | 0.86 | 0.85 |
(a)
Obtained using B3LYP density functional with 38% Hartree-Fock exchange.
(b)
Ligand coordination geometry was obtained by removing CuCl2 from the optimized geometry of the corresponding complex.