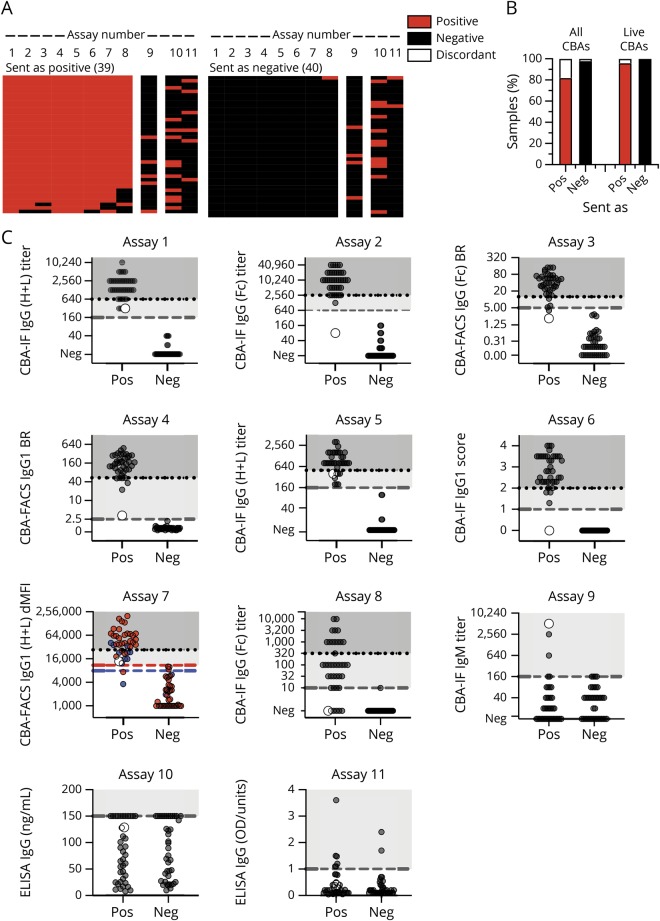
Figure 2. Agreement of MOG-Ab assays on clear positive and negative samples.
(A) Heatmap of the qualitative results for samples sent as clearly positive (n = 39) or negative (n = 40). Each column is an individual assay (1–8 MOG-IgG CBAs, 9 MOG-IgM CBAs, and 10–11 MOG-IgG ELISAs), and each row is an individual serum sample. Results are based on qualitative results; negative samples are black, and positive samples are red. The samples are shown according to their serostatus sent by the individual centers. (B) Agreement of MOG-IgG CBAs according to the samples sent (pos = positive, neg = negative). Results (in % of all samples) are grouped according to their agreement in all 8 CBAs or in the 7 live CBAs (red: positive in all CBAs, black: negative in all CBAs, white: discordant). (C) Quantitative results for all assays. The cutoff values for all assays except assay Nr. 7 are indicated by the dashed gray lines. For assay Nr. 7, cutoff levels for pediatric samples (blue dots) are indicated by the blue dashed line, and cutoff levels for adult samples (red dots) are indicated by the red dashed line. The quantitative range of each assay result for its probability to be seropositive in all live CBAs is indicated by the dotted line and shaded in darker gray (100% probability), whereas the range of discordant samples is shaded in light gray. A single sample with high IgM titer 1:5120 and low positive in the IgG (H + L) and on IgG1 but not in another IgG1 and the IgG(Fc) assays is indicated by the larger white dot. BR = binding ratio; CBA = cell-based assay; dMFI = delta mean fluorescence intensity; Ig = immunoglobulin; MOG = myelin oligodendrocyte glycoprotein.

