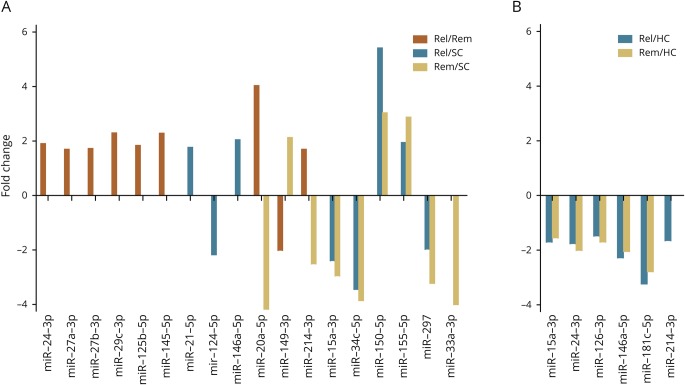
Figure 2. miRNA expression fold change in MS according to disease activity.
Differences in CSF (A) and serum (B) miRNA expression levels. The fold change is calculated as the ratio between the median of the relative miRNA expression level of the respective subgroups. HC = healthy control; miRNA = microRNA; Rel = relapsing MS; Rem = remitting MS; SC = symptomatic control.

