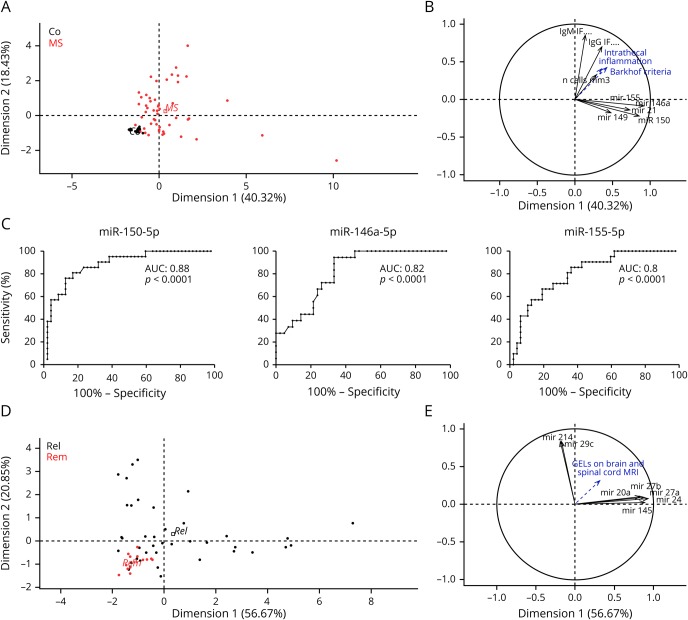
Figure 4. Patient stratification according to diagnosis or disease activity by PCA.
PCA was applied using the significantly upregulated CSF miRNAs in patients with MS and other CSF parameters (IgG or IgM IF, CSF pleocytosis). PCA can distinctly separate MS from SC (A) in a 2-dimensional representation comprising in total 58.75% of sample population variability. The upregulated miRNA panel (i.e., miR-21-5p, -146a-5p, -149-3p, -150-5p, and -155-5p) segregates from other diagnostic criteria (Barkhof imaging criteria, IgM and IgG IF). Cos2 values for each variable are plotted in abscissa and ordinate (B). They represent the strength of the individual variables in indicating population variability according to each dimension (significant above 0.5). ROC curves are plotted (C) for miR-150-5p, -146a-5p, and -155-5p as diagnostic biomarkers for MS with respective areas under the curve of 0.87, 0.82, and 0.8, respectively (p < 0.0001). PCA can also partially separate patients with Rel MS from patients with Rem MS (D) in a 2-dimensional representation comprising in total 77.52% of sample population variability. MiR-20a-5p, -24-3p, -27a-3p, -27b-3p, and -145-5p segregate from miR-29c-3p and miR-214-3p (E). AUC = area under curve; GEL = gadolinium-enhancing lesion; IF = intrathecal fraction; IgG = immunoglobulin G; IgM = immunoglobulin M; miRNA = microRNA; PCA = principal component analysis; Rel = relapsing MS; Rem = remitting MS; ROC = receiver operating characteristic; SC = symptomatic control.

