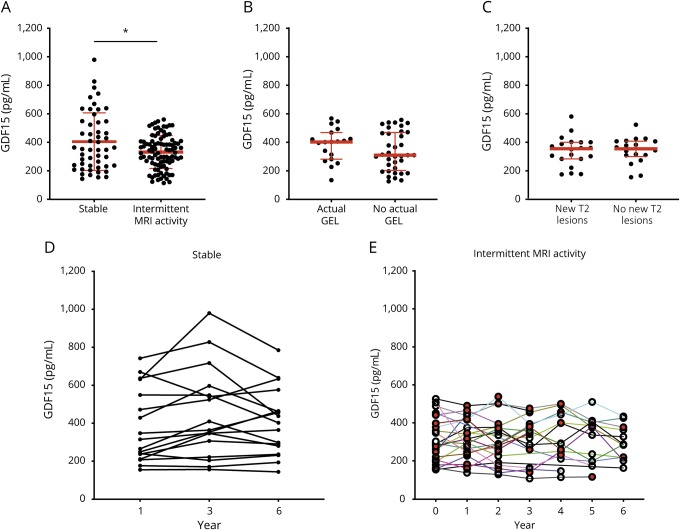
Figure 2. Longitudinal measurements of serum GDF-15 concentrations in patients with MS.
Concentrations of GDF-15 in patients treated with interferon-beta with a continuously stable disease course (stable) and patients with intermittent MRI activity during a median follow-up of 5.9 years (A) (mean + SD). GDF-15 serum concentrations of patients with T2 activity at time points with or without new T2 lesions (B) and patients with intermittent GEL with actual GEL and at time points without GEL (C) (median and IQR). Longitudinal changes of GDF-15 concentrations in stable patients (D) and patients with intermittent MRI activity (E) (red symbols indicate time points with MRI activity). *p < 0.05. GDF-15 = growth differentiation factor 15; GEL = gadolinium-enhancing lesion; SD = standard deviation.

