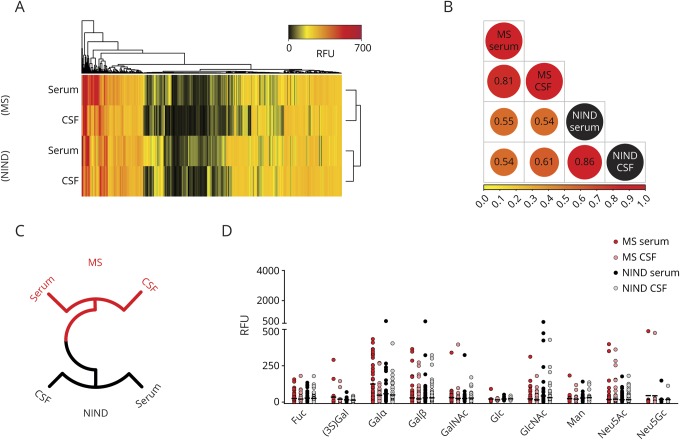
Figure 1. Recognition of carbohydrate structures in glycan array version 5.3 by sera and CSF of patients with MS and NIND.
(A) Heatmap of glycan-binding reactivity, clustered by dendrogram algorithm. Columns represent the reactivity of each specific glycan (n = 600) at an immunoglobulin G concentration of 50 μg/mL, and rows represent the immune profile for each patient subgroup (MS, n = 25; NIND, n = 30). (B) Pearson correlation comparison of glycan recognition in sera and CSF among patients. (C) Circlized dendrogram for recognition of carbohydrate antigens based on RFU. Clusters based on recognition similarity are shown in the same color. (D) Recognition of specific terminal carbohydrate moieties by sera or CSF from patients with MS and NIND. Neu5Ac = N-acetylneuraminic acid; Neu5Gc = N-glycolylneuraminic acid; NIND = noninflammatory neurologic disease; RFU = relative fluorescence unit.

