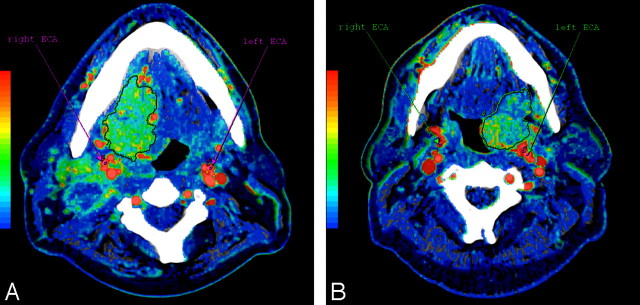
Fig 1.
Functional maps of BF from 2 patients with oropharynx SCCA showing the BF calculated in each pixel of the image in a color scale; in the same figure are also shown the arterial inputs obtained from standardized 4-pixel regions of interest placed in the right and in the left ECA. A, Right base of tongue tumor with extension into floor of the mouth. B, Tumor involving the left tonsillar region with focal extension into the tongue base.

