
Fig 2.
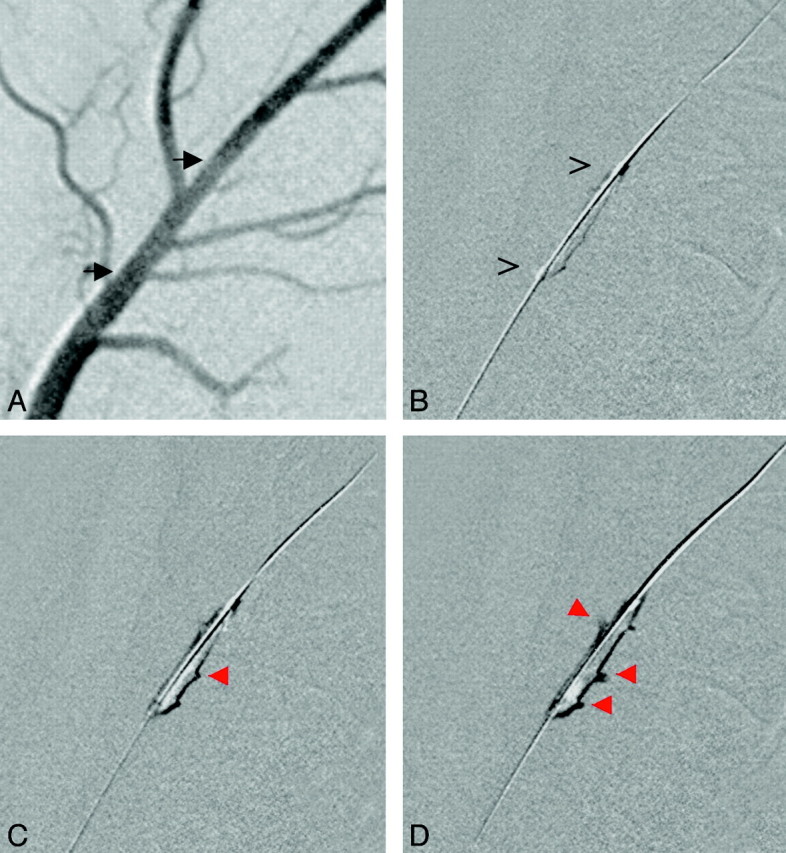
PTA performed for an occlusion of the LA. A, Angiogram before thrombus injection depicts side branches. Black arrows delineate the prospective position of the occluding thrombus. B, The microguidewire and PTA balloon are placed at the thrombus (open arrows). C and D, During balloon inflation (C), the thrombus is compressed and penetrates into side branches (red arrows) of the LA located contralateral to the balloon (D).