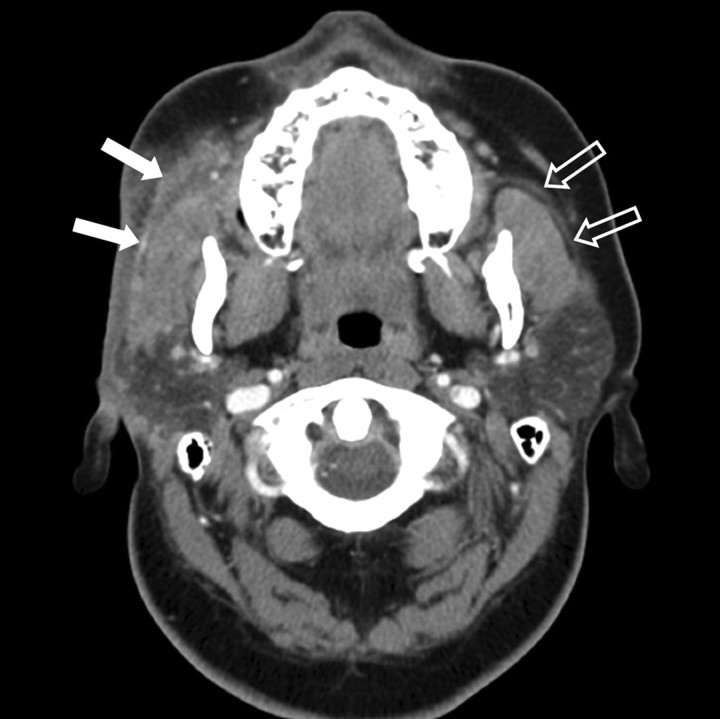
Fig 2.
Axial contrast-enhanced CT scan shows ill-defined fat plane between the muscles. The proximal right parotid duct (white arrows) is embedded within the lesion. Note normal left parotid duct (outlined arrows). Note flattened right facial contour, reduced bulk of right-sided subcutaneous fat compared with the left.

