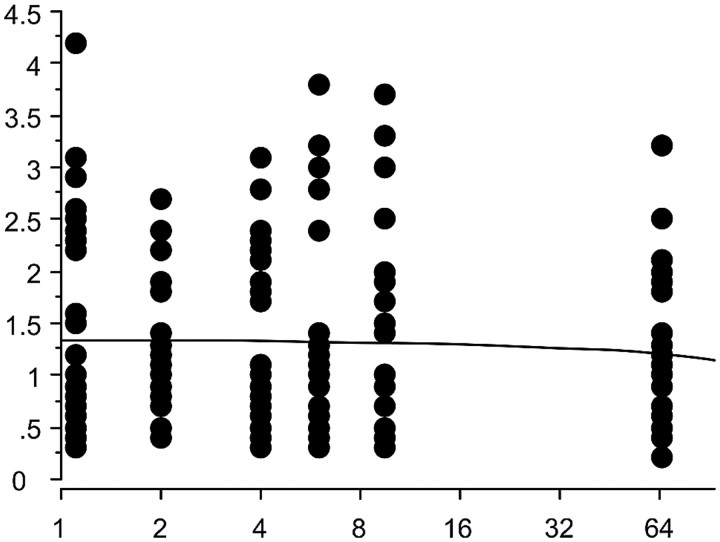
Fig 5.
Scatterplot of accuracy measurements in millimeters for screw-marked points depicted on the y-axis. CAS-CT dose used in mGy depicted on the logarithmic x-axis. Each column represents the accuracy in mm for 7 screw-marked points on 4 cadaveric heads for registration with CAS-CT at a given dose. The regression line shows no clinically significant slope for accuracy with exponential growth of the radiation dose in the dose interval tested. Note that slight irregularities of the regression line due to the limited resolution of the software used for statistical analysis were straightened by using Photoshop (Adobe Systems, San Jose, Calif), without altering the content of the graphic.

