
Fig 2.
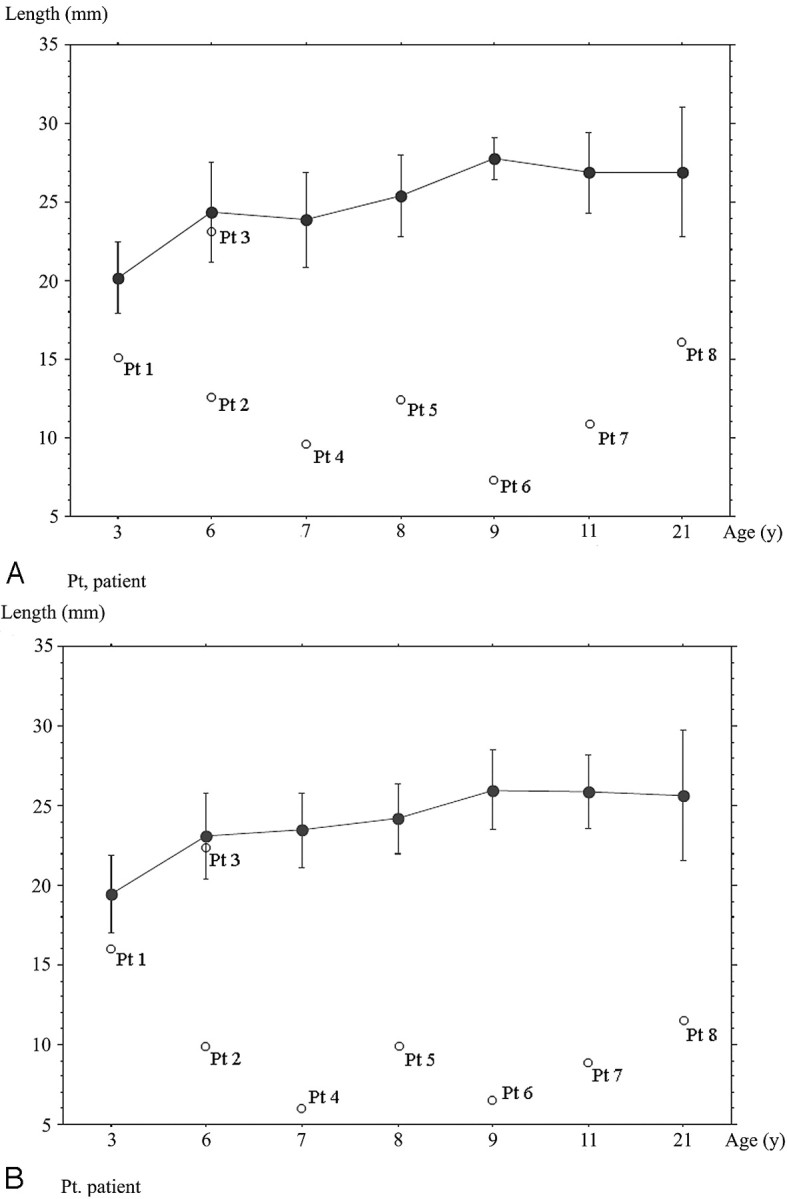
Line graph and bars show means and SDs of the length of Ba-Es (A) or Ba-Xs (B) for each age group of healthy controls. White dots show the length of Ba-Es or Ba-Xs of patients with CHARGE syndrome. Pt indicates patient.
Official websites use .gov
A
.gov website belongs to an official
government organization in the United States.
Secure .gov websites use HTTPS
A lock (
) or https:// means you've safely
connected to the .gov website. Share sensitive
information only on official, secure websites.
Line graph and bars show means and SDs of the length of Ba-Es (A) or Ba-Xs (B) for each age group of healthy controls. White dots show the length of Ba-Es or Ba-Xs of patients with CHARGE syndrome. Pt indicates patient.