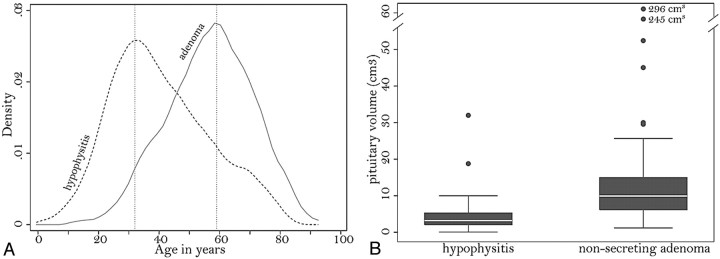
Fig 2.
A, Kernel attenuation estimate of the age distribution in patients with AH (dashed line) or nonsecreting pituitary adenoma (continuous line). B, Boxplots show the distribution of pituitary volume in patients with hypophysitis or adenoma. Each box represents the middle half of the distribution (interquartile range) and contains a solid line to indicate the median. The top (and bottom) whisker line extends from the 75th (and 25th) percentile to a calculated value corresponding to 1.5 times the interquartile range. The points outside the ends of the whiskers indicate outliers.

