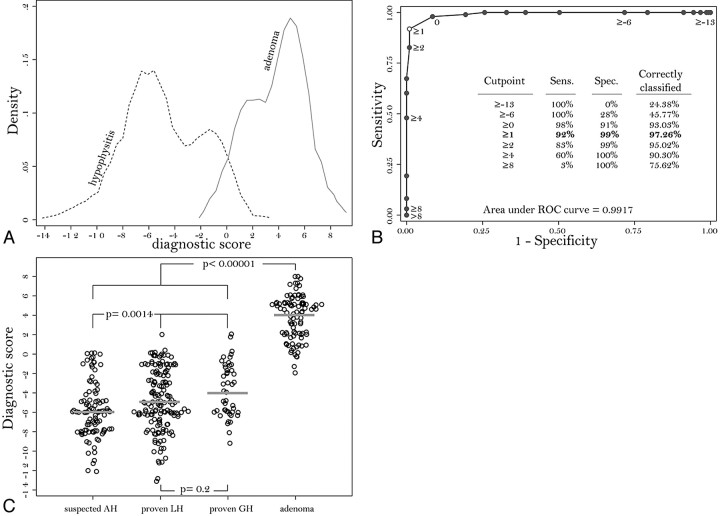
Fig 3.
A, Kernel attenuation estimate of the score distribution in patients with AH (dashed line) or nonsecreting pituitary adenoma (continuous line). B, ROC curve shows sensitivity (Sens.) and 1-specificity (Spec.) obtained by using each value of the score (from −13 to +8) as a possible classification cut-point for the diagnosis. The best cut-point is 1, which classifies correctly 97.26% of the patients. The AUC, representing the overall performance of the score, is 0.9917. C, Dotplot shows the distribution of the score in suspected AH, biopsy-proved lymphocytic hypophysitis (LH), biopsy-proved granulomatous hypophysitis (GH), and nonsecreting pituitary adenoma.

