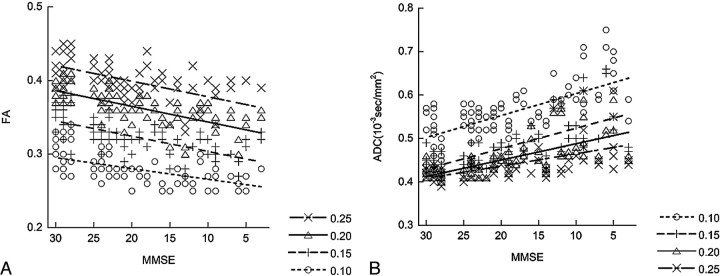
Fig 3.
The correlations between the MMSE score and the mean FA value (A) and mean ADC value (B) of the uncinate fasciculus with their linear regression lines are shown. Tractographies of the uncinate fasciculus are drawn under 4 different FA thresholds (0.10, 0.15, 0.20, and 0.25). A higher FA threshold results in a lower mean ADC value and a higher mean FA value along the uncinate fasciculus. For mean FA values, the Rs are 0.59 for an FA threshold of 0.25, 0.73 for a threshold of 0.20, 0.68 for a threshold of 0.15, and 0.56 for a threshold of 0.10. For mean ADC values, Rs are −0.58 for an FA threshold of 0.25, −0.70 for a threshold of 0.20, −0.71 for a threshold of 0.15, and −0.66 for a threshold of 0.10. An FA a threshold of 0.20 shows higher correlation between mean FA values and the MMSE score, whereas FA thresholds of 0.15 and 0.2 show a higher correlation between mean ADC and MMSE scores.

