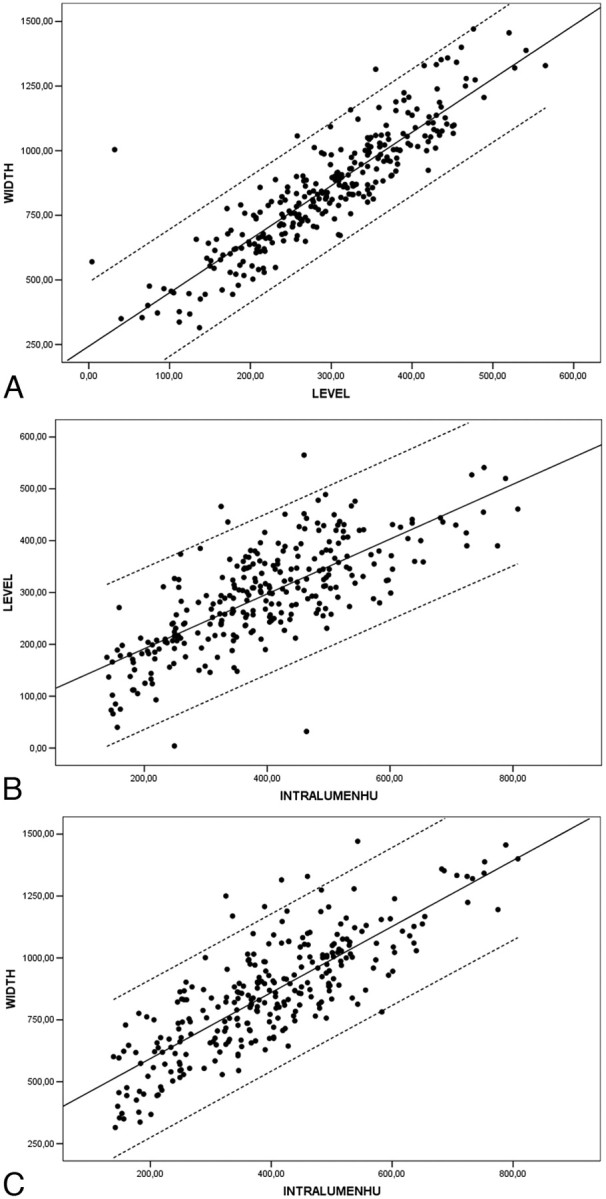
Fig 1.

A, Scatterplot between width and level (NASCET II-V) with linear regression through the origin, with a 99% mean predictive interval and 99% individual predictive interval. Width = 2.81 × Level. B, Scatterplot between intraluminal Hounsfield unit values (IntraluminHU) and level (NASCET II-V) with linear regression through the origin with a 99% mean predictive interval and a 99% individual predictive interval. Level = 0.72 × Intraluminal HU. C, Scatterplot between intraluminal Hounsfield unit value and width (NASCET II-V) with linear regression through the origin with a 99% mean predictive interval and 99% individual predictive interval. Width = 2.07 × Intraluminal HU Value.
