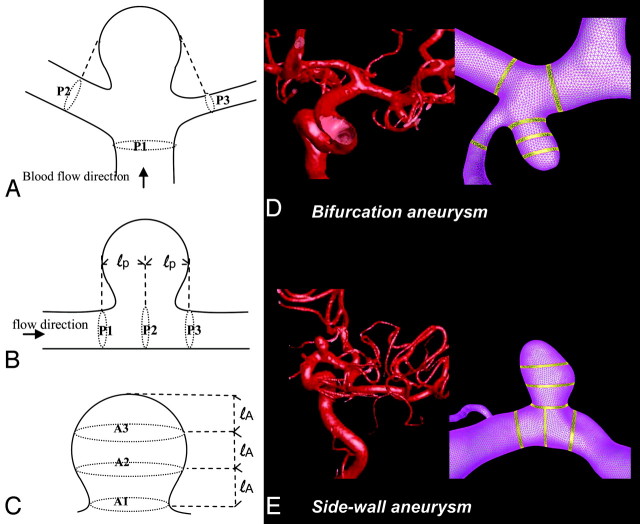
Fig 1.
Schematic representations of regions for hemodynamic data analysis. A, Regions in the arteries of terminal or bifurcation aneurysms. B, Regions in the arteries of sidewall aneurysms. C, Regions in the aneurysm dome. D and E, Application to patient-specific aneurysm models are shown for a bifurcation aneurysm (D) and a sidewall aneurysm (E).

