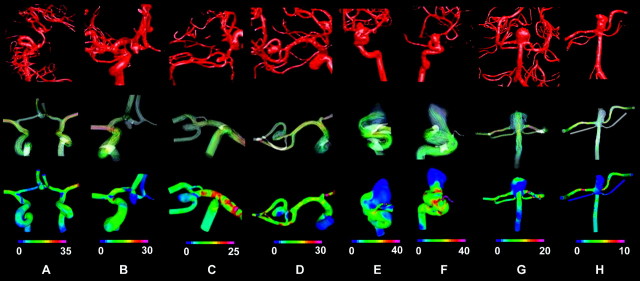
Fig 2.
Representative hemodynamic results for AcomA (A and B), MCA (C and D ), ICA (E and F ), and BA (G and H ) aneurysms. Top row is the 3DRA images obtained for each aneurysm during the clinical procedure. A diversity of aneurysms and complicated arterial structures can be observed. The middle row (flow pattern) and the bottom row (WSS) are the hemodynamic results obtained from the simulation. Flow pattern and WSS show differences among aneurysms, and each one has a unique pattern in the arteries and the aneurysms. WSS is in pascal units.

