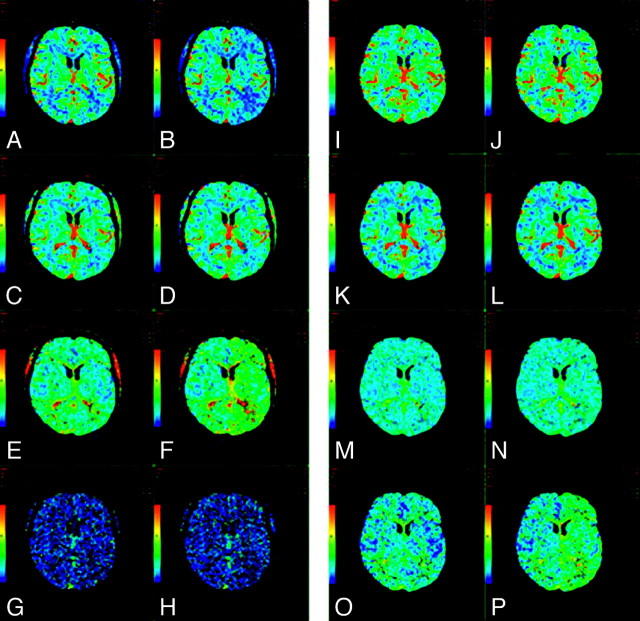
Fig 2.
A−H, CTP maps calculated by using a delay-sensitive deconvolution algorithm that is affected by the delay (To) between arterial input and tissue curves. To simulate a range of To, we processed the dynamic images of a single section from a CTP study on a patient with brain tumor such that time-versus-enhancement curves from the entire left hemisphere were shifted forward in time by 2 seconds relative to the right hemisphere. The original and time-shifted CTP studies were then processed by Perfusion 3 (GE Healthcare) by using the same arterial input curve and venous curve from the right hemisphere. A and B, CBF maps for the original and the To = 2 second study. C and D, The corresponding CBV maps. E and F, The corresponding MTT maps. G and H, The corresponding To maps. As To increases, CBF decreases and MTT increases while CBV remains unchanged. The deconvolution algorithm is not able to estimate To. I−P, CTP maps calculated by using a delay-insensitive deconvolution algorithm that is unaffected by the To between arterial input and tissue curves. The original and time-shifted CTP studies of I−P are processed in the same way as A−H except that a delay-insensitive deconvolution algorithm (Perfusion 4, GE Healthcare) is used instead. I and J, The CBF maps for the original and To = 2 second study. K and L, The corresponding CBV maps. M and N, The corresponding MTT maps. O and P, The corresponding To maps. As To increases, CBF and CBV remain relatively unchanged and MTT increases slightly. The deconvolution algorithm is able to detect an increase in To, but the estimate of To is not accurate.

