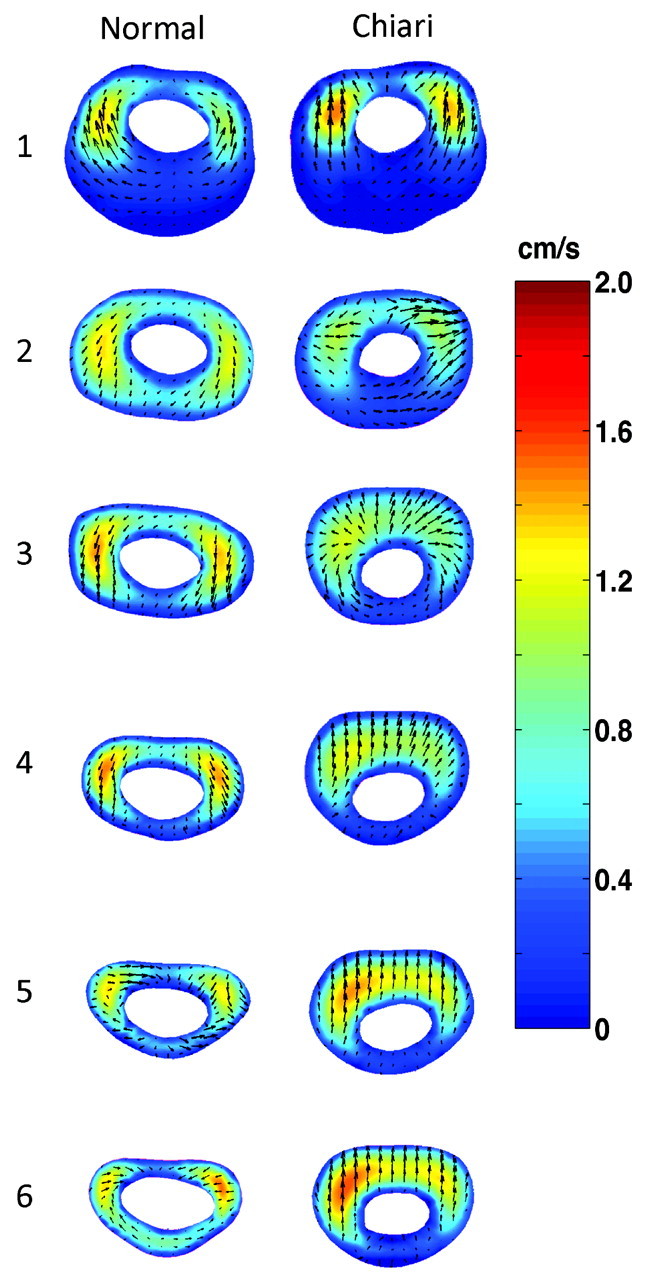
Fig 4.

Computed CSF flow velocities by CFA at peak diastole in 6 different axial levels in a healthy model (left column) and Chiari I model (right column). Colors indicate the magnitude of the axial velocity (caudal-to-cephalad direction); arrows show the direction and magnitude of secondary velocities (anterior, medial, or posterior direction).
