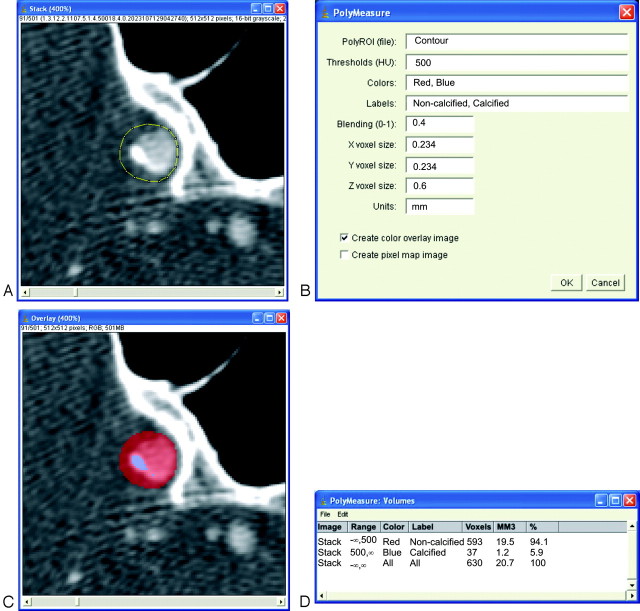
Fig 2.
A, Regions of interest (region of interest) are drawn on axial images that show calcifications. Care is taken to include the whole calcification and not to include any other high-attenuation structures (eg, skull base). Because a minimum attenuation of 500 HU is defined for the presence of calcifications, lumen can be included in this region of interest, for lumen will not reach such a high level of attenuation. All regions of interest of 1 patient are saved within 1 file. B, The polymeasure software uses the contour file, the 500-HU threshold, and the voxel dimensions (0.234 × 0.234 × 0.6 mm) to create a color overlay image and a statistics table. C, The color overlay image shows which pixels within the region of interest are above the predefined 500-HU threshold (blue) and which are below this threshold (red). D, The statistics table presents the amount of calcium pixels and the calcium volume (cubic millimeters).

