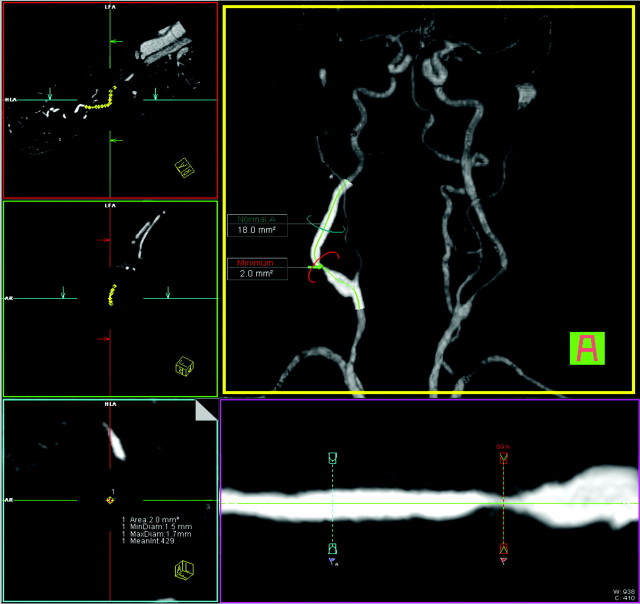
Fig 2.
Same patient as in Fig 1. User interface of tool B (Vessel View): orthogonal images aligned to the center line on the left side. A volume-rendered 3D model of the MRA with an overlaid curved planar reformation is displayed in the middle. The green line indicates the center line. The stretched vessel views (middle row, bottom) indicate the positions of the stenosis measurements and the reference site. The area measurements are displayed in the volume-rendered image; the values for the stenotic lumen are in the left lower image. All values can be displayed in the “measurements” card. MinDiam indicates minimum diameter; MaxDiam, maximum diameter.

