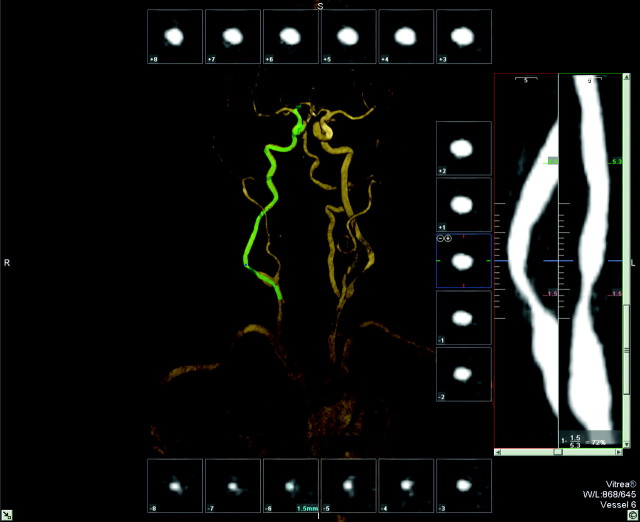
Fig 3.
Same patient as in Fig 1. User interface of tool C (Vitrea): cross-sectional images aligned perpendicular to the center line surrounding a volume-rendered 3D model of the MRA. The green line indicates the center line. The stretched vessel views on the right side indicate the position of the cross-sectional images at different viewing angles; the site of the (manual) measurements and the corresponding values are given. The stenosis value is displayed in the lower right corner.

