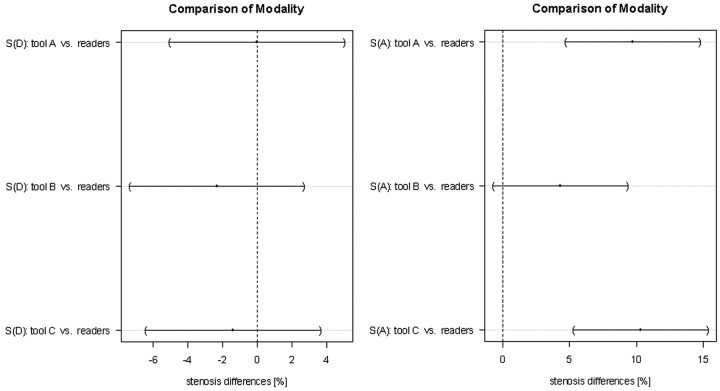
Fig 5.
Comparison of the modalities for diameter stenosis measurements (S[D]) and area stenosis measurements (S[A]) for the symptomatic side only. The dots indicate the mean difference, and the horizontal lines represent 95% Tukey intervals. The differences between the pairs that do not cross the zero line are statistically significant.

