
Fig. 1. Association rules on a simplified example.
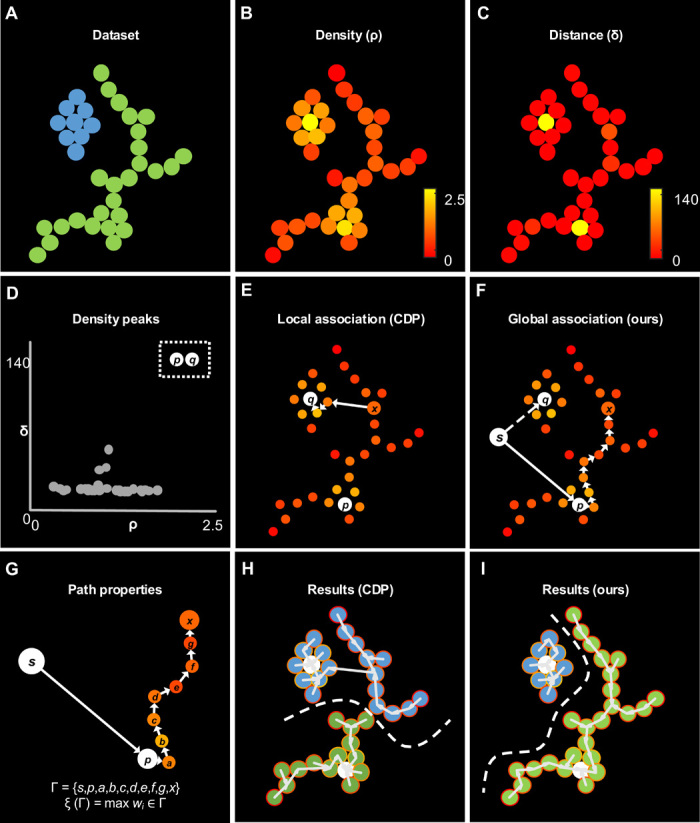
(A) Raw data points in a 2D space. (B) Color-coded point density (ρ). (C) Color-coded distance to the closest point with a higher density (δ). (D) Density-distance plot for selecting density peaks (dashed box), characterized as outliers with sufficiently high density and distance. In this case, the density peaks correspond to the points p, q in (E) and (F). (E) Local association rule of CDP connecting a point x, to the closest point with higher density, until this is a density peak. This happens regardless of the other connections. (F) Global association rule of the proposed method, which computes the optimal path to connect a starting node s to a generic point x, passing by density peaks. (G) The path from S, via p, to x can be evaluated according to its properties, such as the maximum gap included. (H) Color-coded results of CDP. (I) Color-coded results of the proposed algorithm.