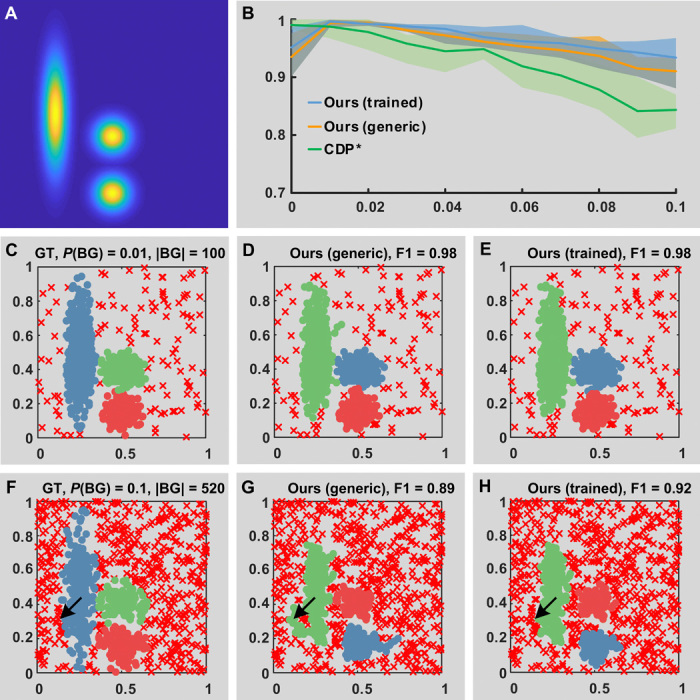
Fig. 4. Robustness to background noise.

(A) Synthetic probability distribution from which point distributions are drawn. Lighter areas have the maximum probability. The area in blue is a background with uniform probability from 0 to 0.1, corresponding to a number of points from 10 to 52% of the total. (B) Quantitative performance degradation assay with respect to the value of background probability. A total of 1000 points are drawn from the probability distribution in (A), varying the background uniform probability from 0 to 0.1. For each level of background probability, n = 5 replicates are generated. Bold lines refer to the mean of the F1 score among the replicates, while the shaded lines correspond to the range. Three peaks were selected using γ ranking (5). (C to E) Qualitative results with a background probability of 0.01, corresponding to 900 points from the clusters and 100 points in the background. Cluster labels are color coded. Red x correspond to noise. (F to H) Qualitative results with a background probability of 0.1, corresponding to 480 points from the true clusters and 520 points in the background. Arrows indicate an aggregation of points in the background. The trained algorithm detects those points as noise.
