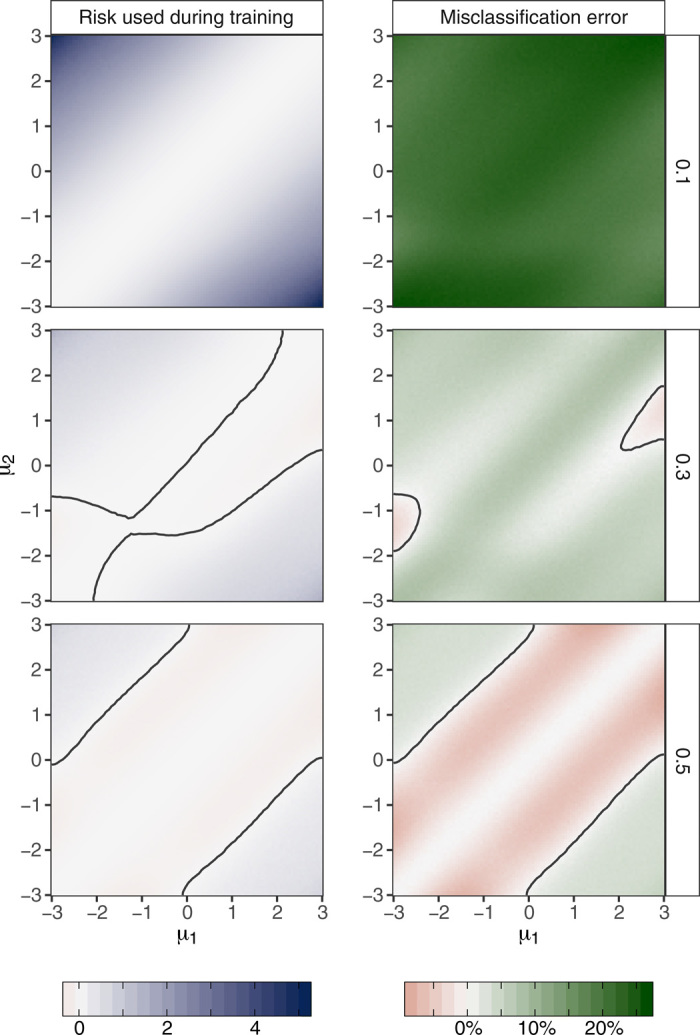
Fig. 4. Performance of learned clustering procedure compared to performance of the EM.

The difference between the risk of EM and our learned procedure is displayed—larger values indicate that our learned procedure outperformed EM. Three fixed values of the mixture weight ω are considered: 0.1,0.3, and 0.5. Contours indicate comparable performance of our learned clustering procedure and EM. Contours are drawn using smoothed estimates of the difference of the risks of the two procedures, where the smoothing is performed using k-nearest neighbors (k = 25). Our learned procedure outperformed EM both in terms of the risk in (3) that was used during training, and in terms of misclassification error.
