
Figure 2.
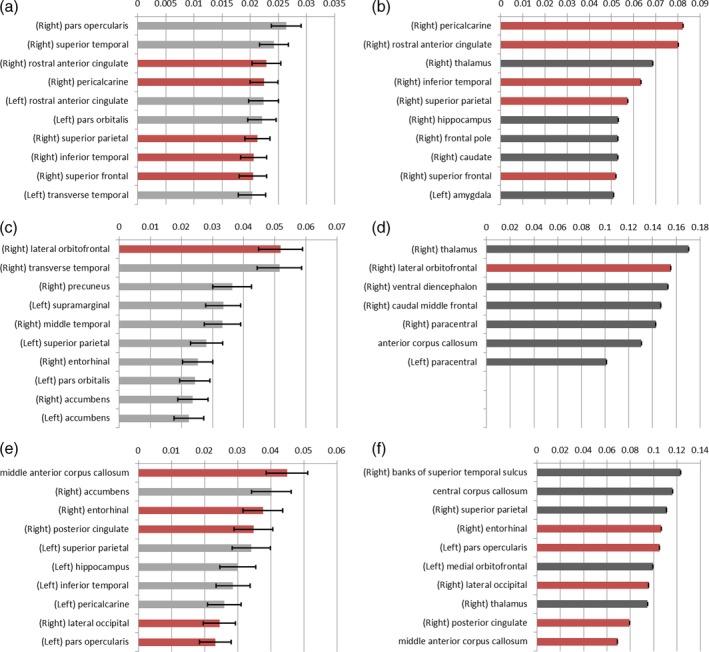
Relative importance of each network property—regions of interest (ROIs) in the machine learning model. The 10 ranking ROIs in each machine learning model are presented. Random forest models are indicated in grey. XGBoost models are denoted in black. The error bars indicate the standard deviation. Error bars could not be visualized for the XGBoost models due to small standard deviations. The ROIs contributing to both RF and XGBoost models for each nodal feature are indicated in red. (a) Local efficiency (RF), (b) local efficiency (XGBoost), (c) degree (RF), (d) degree (XGBoost), (e) betweenness centrality (RF), and (f) betweenness centrality (XGBoost)