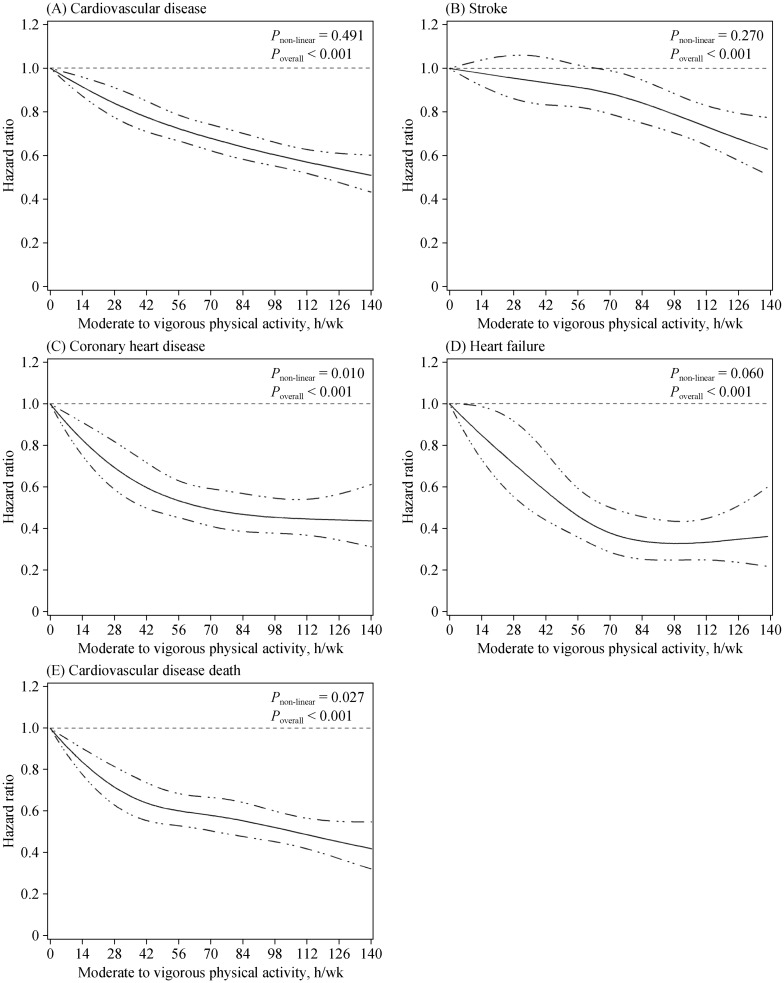
Figure 4. Hazard ratios for cardiovascular events according to MVPA levels.
(A): Cardiovascular disease; (B): stroke; (C): coronary heart disease; (D): heart failure; and (E): cardiovascular disease death. Data were fitted by restricted cubic spline Cox proportional hazards models, with four knots placed at the 5th, 35th, 65th, and 95th percentiles of MVPA. Covariates were the same as Model 2 in the main analysis, including age, sex, geographic region, urbanization, drinking status, current smoking status, education level, family history of cardiovascular disease, light physical activity, and cohort sources. Results were reported as hazard ratios (solid line) and 95% confidence intervals (dashed line). MVPA: moderate to vigorous physical activity.

