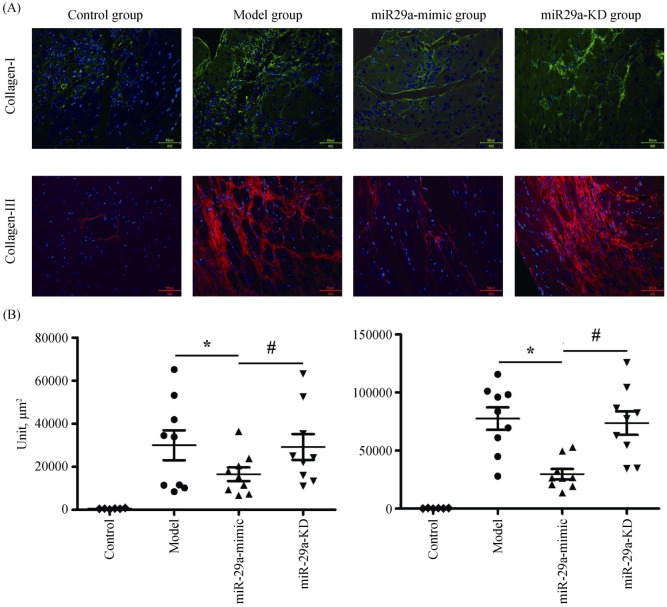
Figure 3. Inhibition of miR-29a on cardiac collagen.
(A): The image showing the expression of myocardial tissue collagen I and III under the fluorescence microscope (400 ×); and (B): the levels of collagen I and III. Data are indicated as the means ± S.E. *P < 0.05, miR-29a-mimic group vs. model group; #P < 0.05, miR-29a-KD group vs. miR-29a-mimic group. miR-29a-KD: miR-29a-knockdown.

