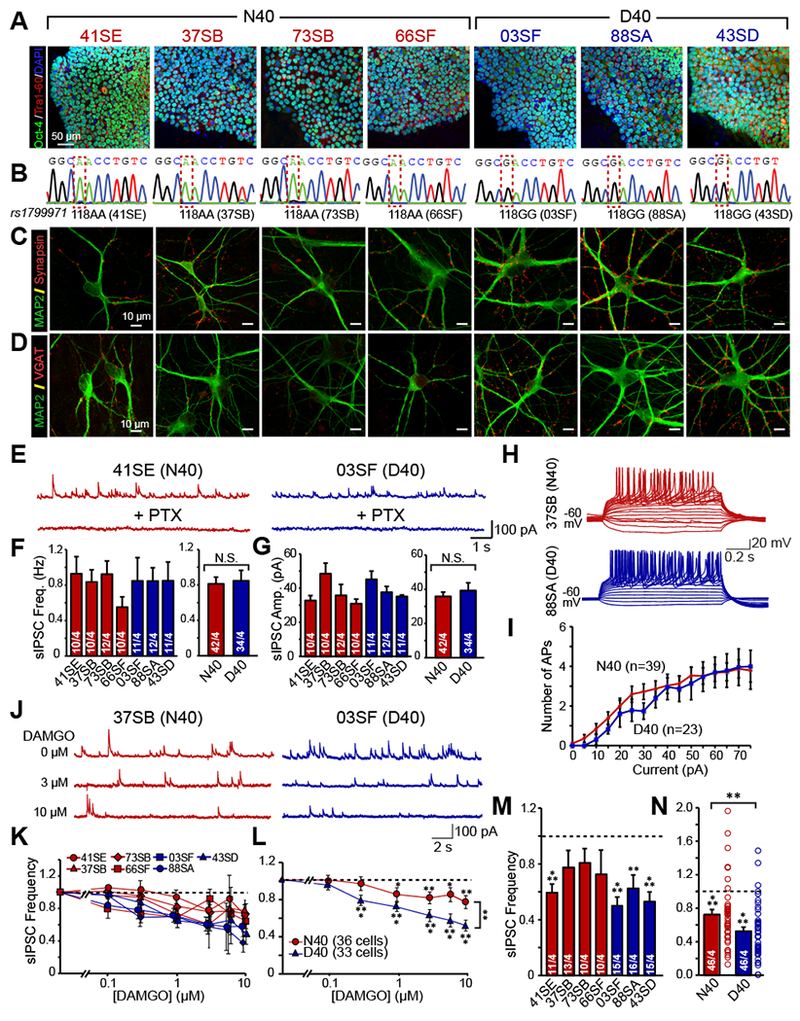
Figure 1 |. MOR N40D expressing inhibitory human neurons exhibit more robust suppression of inhibitory synaptic transmission by DAMGO.

(A) Oct4 (green), Tra 1-60 (red), and DAPI (blue) ICC for N40 and D40 subject iPS cells depicting pluripotency (B) Sequencing confirming homozygous A118 or G118 genotype of human iPS cell lines (C) MAP2 (green) and Synapsin (red) ICC of iN cells generated from N40 and D40 subject iPS cells (D) MAP2 (green) and VGAT (red) ICC of induced inhibitory neuronal (iN) cells generated from N40 and D40 subject iPS cells (E-G) Both N40 and D40 iN cells exhibit PTX sensitive spontaneous IPSCs whose frequency (N40 vs D40: N.S.) and amplitude (N40 vs D40: N.S.) are unaffected by MOR N40D substitution (H) Representative traces of action potentials induced by step current injections (from −20 to +75 pA, 5 pA increments) during current clamp recordings from one N40 and D40 cell line (I) Quantification of induced action potentials in inhibitory iNs cells illustrating that neuronal excitability is unchanged as a consequence of MOR N40D (N40 vs D40: N.S. at all current injections) (J) Representative traces of sIPSCs recorded to increasing concentrations of DAMGO in N40 and D40 iN cells (K) Quantification of inhibition of sIPSC frequency in individual subject derived N40 and D40 iN cells (L) Merged data of the four N40 and three D40 subject lines illustrates that D40 iN cells exhibit stronger suppression of IPSC frequency compared to N40 iN cells (M-N) sIPSC frequency response to a single concentration of 10 ¼M DAMGO; data is normalized to control (N40 vs control: p<0.001, D40 vs control: p<0.001). Summary graphs are shown as individual cell lines or merged data of either four N40 patients (red bars) and three D40 patients (blue bars) (N40 vs D40: p <0.01). Data are depicted as means ± SEM. Numbers of cells/Number of independently generated cultures analyzed are depicted in bars. Paired t-test was used to evaluate within genotype statistical differences and one-way ANOVA was used to evaluate between genotype statistical differences (*p <0.05, **p <0.01, ***p <0.001).
