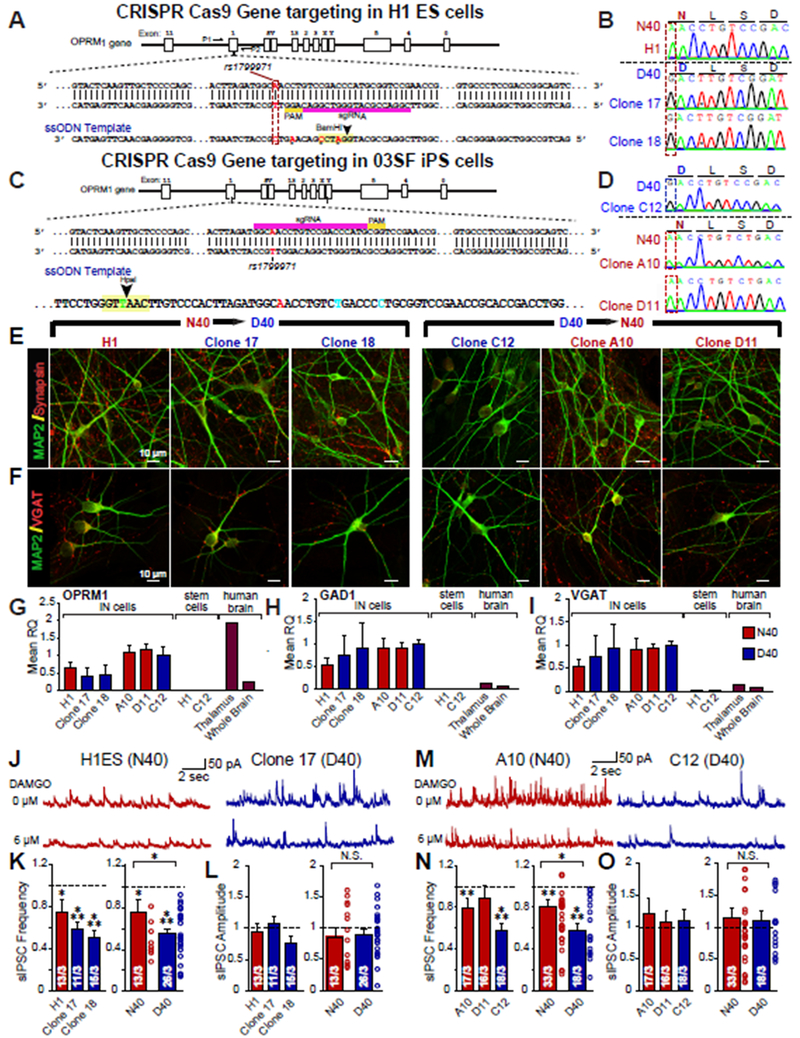
Figure 2 |. Human neurons from two sets of independently targeted isogenic human stem cell lines for OPRM1 A118G validate differential DAMGO response observed in patient cell lines.
(A) OPRM1 Targeting Strategy 1: Structure of OPRM1 gene on chromosome 6 and schematic overview of CRISPR/Cas9 gene targeting strategy to knock-in homozygous G118 alleles into human H1 embryonic stem cell (H1ES) in which sgRNA targets donor strand. In the 140bp ssODN, we inserted a T to C mutation to incorporate OPRM1 GG118, synonymous G to A for PAM mutation, and synonymous G to C and G to A mutations to create a BamHI restriction enzyme site. (B) Sequencing of original H1ES control cell line carrying homozygous A118 (N40) alleles, and two isolated clones carrying homozygous OPRM1 G118 (D40) alleles (Clone 9-2-17, Clone 9-2-18). (C) OPRM1 Targeting Strategy 2: Structure of OPRM1 gene on chromosome 6 and an independent CRISPR/Cas9 gene targeting strategy to correct 03SF patient line (originally homozygous G118 expressing MOR D40) to homozygous A118 (N40). We designed a 200 nt template strand to knock-in homozygous A118 alleles, containing mutations to generate a HpaI restriction enzyme site for screening (D) Sequencing of passage-matched, uncorrected 03SF patient cell line carrying homozygous D40 alleles (C12) and two gene-corrected clones (Clone A10, D11) carrying homozygous OPRM1 A118 (N40) alleles after subcloning. (E) ICC of MAP2 (green) and Synapsin (red) of iN cells produced from gene-targeted ES cells and iPS cells. (F) Immunofluorescence of MAP2 (green) and VGAT (red) of iN cells produced from gene-targeted ES cells and iPS cells. (G-I) Relative mRNA levels of OPRM1 as well as markers for inhibitory subtype specificity (GAD1, VGAT) measured by quantitative RT-PCR; mRNA levels are normalized to Synapsin I. Data are represented as means of three independently differentiated batches of iNs from each patient iPS cell line. (J) Representative traces of sIPSCs recorded to increasing concentrations of DAMGO in N40 and D40 iN isogenic iN cells derived from ES cells. (K-L) Quantification of sIPSC frequency (H1 vs control: p <0.05, Clone 17 vs control: p <0.001, Clone 18 vs control: p <0.001, N40 vs control: p <0.05, D40 vs control: p <0.001, N40 vs D40: p <0.05) and amplitude in response to 6 ¼M DAMGO (H1 vs control: N.S., Clone 17 vs control: N.S., Clone 18 vs control: N.S., N40 vs control: N.S., D40 vs. control: N.S., N40 vs D40: N.S.) (M) Representative traces of sIPSCs recorded to increasing concentrations of DAMGO in N40 and D40 iN isogenic iN cells derived from iPS cells. (N-O) Quantification of sIPSC frequency (A10: DAMGO vs control: p <0.01, D11: DAMGO vs control: N.S., C12: DAMGO vs control: p <0.001, N40: DAMGO vs control: p <0.01, D40: DAMGO vs control: p <0.001, N40 vs D40: p <0.05) and amplitude in response to 6 ¼M DAMGO (A10: DAMGO vs control: N.S., D11: DAMGO vs control: N.S., C12: DAMGO vs control: N.S., N40: DAMGO vs control: N.S., D40: DAMGO vs. control: N.S., N40 vs D40: N.S.). Data are depicted as means ± SEM. Numbers of cells/Number of independently generated cultures analyzed are depicted in bars. Paired t-test was used to evaluate within genotype statistical differences and one-way ANOVA was used to evaluate between genotype statistical differences (*p <0.05, **p <0.01, ***p <0.001).

