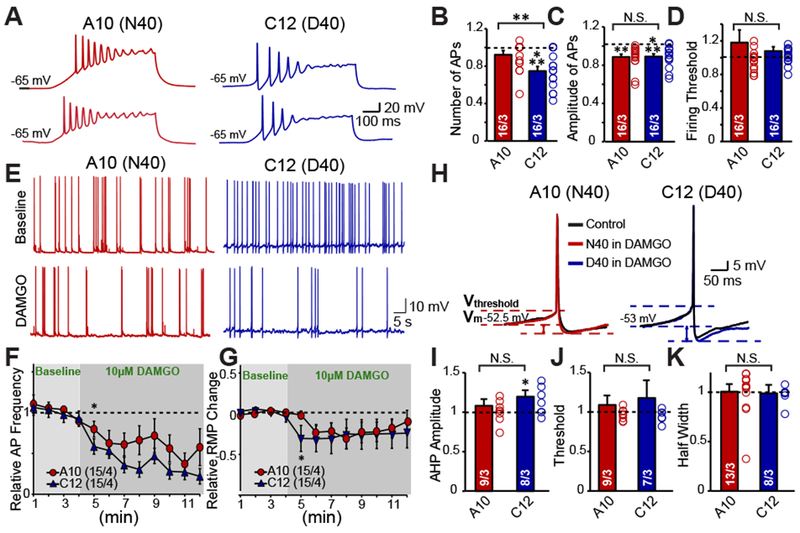
Figure 4 |. D40 iN cells exhibit a sustained decrease in intrinsic excitability.

(A) Representative traces of repetitive action potentials generated from depolarizing current injections in one N40 (A10) cell line derived iN and one D40 (C12) cell line derived iN, and their response to DAMGO (B-D) Summary graphs of DAMGO effect on AP Number (A10: DAMGO vs control: N.S., C12: DAMGO vs control p <0.001), amplitude (A10: DAMGO vs control p <0.01, C12: DAMGO vs control p <0.001) and firing threshold (A10: DAMGO vs control: N.S., C12: DAMGO vs control: N.S.). Data normalized to before DAMGO application reveals DAMGO preferentially decreases intrinsic excitability of D40 iNs but not N40 iNs (DAMGO effect on frequency: A10 vs C12 p <0.01) with no effect on amplitude (A10 vs C12: N.S.) or firing threshold (A10 vs C12: N.S.) (E) Representative traces depicting the effect of DAMGO on spontaneous action potential firing in one D40 (C12) and one N40 (A10) cell line derived iN (F) Quantification of number of spontaneous action potentials fired before and after DAMGO application in N40 and D40 iNs represented as a time course (G) Quantification of resting membrane potential before and after DAMGO application in N40 and D40 iNs represented as a time course (H) Representative traces of individual Action Potentials before and after DAMGO in N40 and D40 iN cells (J-K) Summary graphs depicting that DAMGO causes a trending increase in the after hyperpolarization potential (AHP) amplitude in D40 iN cells compared to N40 iN cells (A10: DAMGO vs control: N.S., C12: DAMGO vs control: p <0.05, A10 vs C12: N.S.) with no effect on firing threshold (A10: DAMGO vs control: N.S., C12: DAMGO vs control: N.S., A10 vs C12: N.S.) or half width (A10: DAMGO vs control: N.S., C12: DAMGO vs control: N.S., A10 vs C12: N.S.). Data are depicted as means ± SEM. Numbers of cells/Number of independently generated cultures analyzed are depicted in bars. Paired t-test was used to evaluate within genotype statistical differences and one-way ANOVA was used to evaluate between genotype statistical differences (*p <0.05, **p <0.01, ***p <0.001).
