Figure 1.
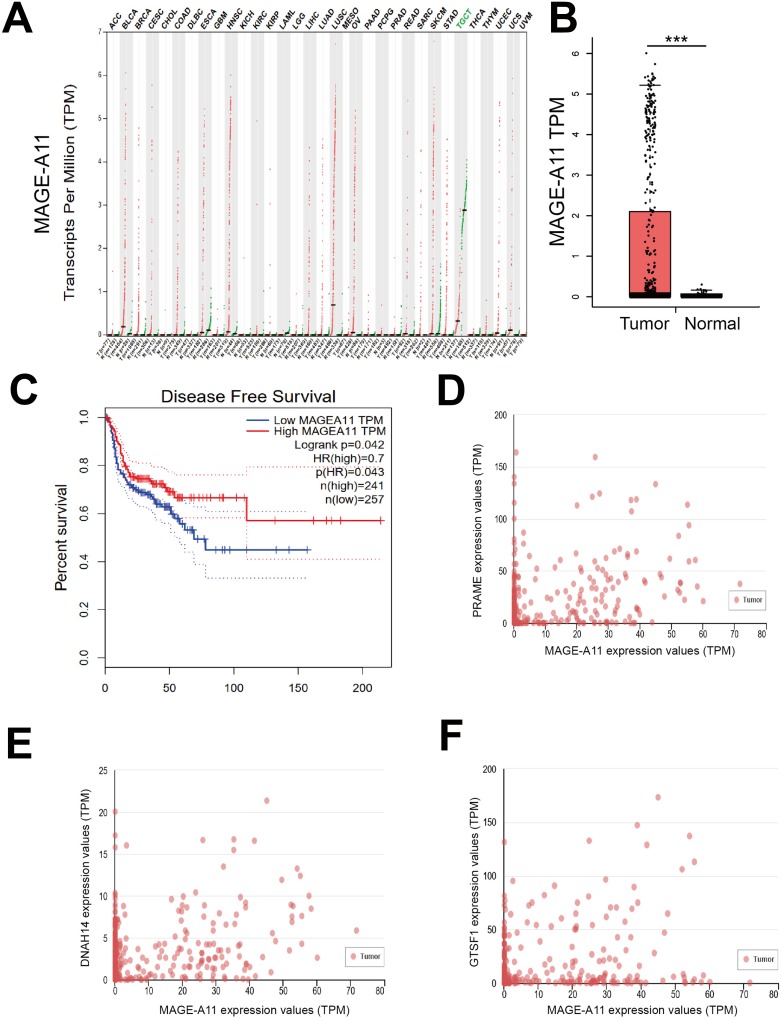
MAGE-A11 levels in HNSCC patients from bioinformatics analysis. (A) MAGE-A11 expression profile across all tumor samples and paired normal tissues. Each dot represents expression of samples. (B) MAGE-A11 mRNA expression in HNSC cancer tissues (T) and Normal tissues (N). (***P < 0.001). (C) Kaplan–Meier survival curves for disease-free survival (DFS) in HNSCC patients according to MAGE-A11 expression (P = 0.042). (A–C) data were from GEPIA online tool. (D–F) Genes positively correlated with MAGE-A11 in HNSCC by UALCAN online tool.

