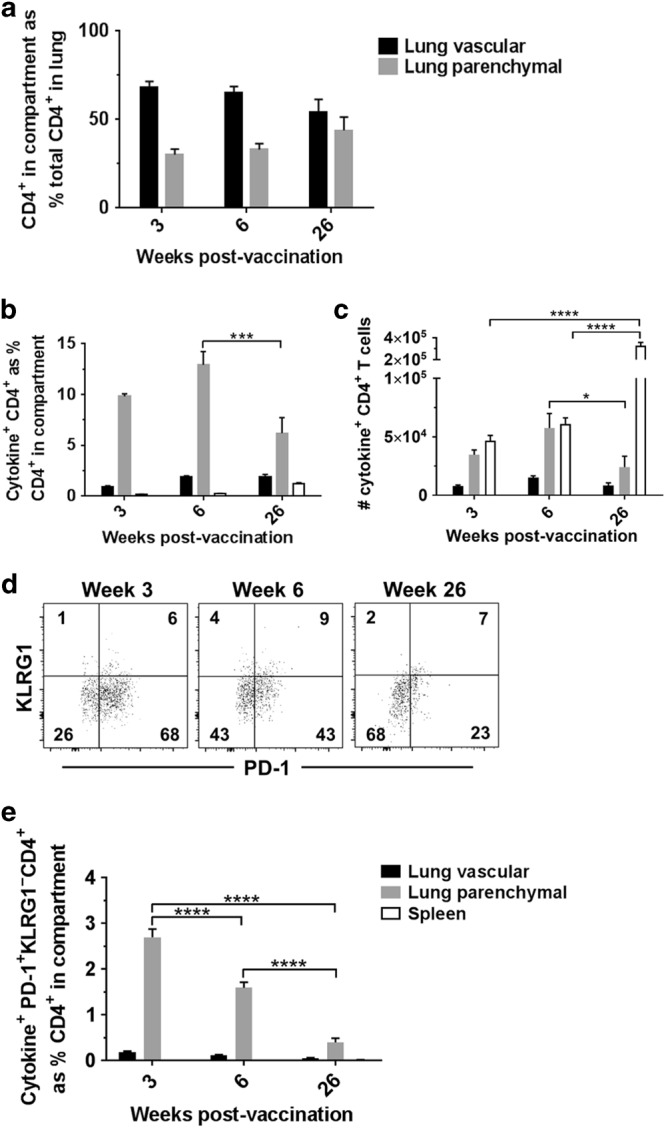
Fig. 6.

Lung parenchymal PD-1+ KLRG1− CD4+ T cells decrease with time after mucosal BCG vaccination. Mice were vaccinated with BCG via IN or ID route 3, 6 or 26 weeks prior to intravascular staining and ICS to identify populations of lung parenchymal, lung vascular and spleen antigen-specific (cytokine+) CD4+ T cells. a Frequency of lung parenchymal and lung vascular CD4+ T cells as a % of total CD4+ T cells isolated from the lung. Statistical comparison conducted between the same compartments at different time points, all non-significant. b Frequency of BCG-induced antigen-specific cytokine+ CD4+ T cells. c Number of BCG-induced antigen-specific cytokine+ CD4+ T cells. d Representative plots from IN-immunised mice, pre-gated on cytokine+ CD4+ T cells, showing surface staining for PD-1 and KLRG1 in the lung parenchyma. e Frequency of cytokine+ CD4+ T cells expressing a PD-1+ KLRG1− phenotype. For all graphs, bars represent mean ± SEM (n = 6). Two-way ANOVA with Sidak’s post-test, ***Ρ < 0.001, ****Ρ < 0.0001
