Fig. 1.
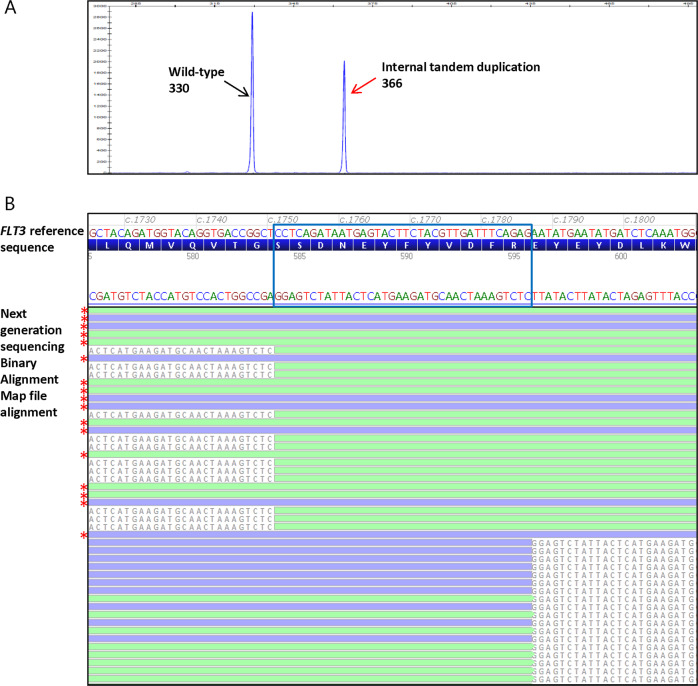
A representative acute myeloid leukemia case harboring an FLT3-internal tandem duplication tested by fragment analysis and next generation sequencing. a FLT3 mutational analysis by fragment analysis test showing the presence of an FLT3-internal tandem duplication; x axis represent the PCR product size in base pair (bp) and y axis represent the fluorescence intensity. The wild-type peak at 330 bp (black arrow) and FLT3-internal tandem duplication peak at 366 bp (red arrow) were indicated. The FLT3-internal tandem duplication/wild-type allelic ratio was 0.7 as calculated from the internal tandem duplication and wild-type peak fluorescence intensity ratio. b Next generation sequencing read alignments displayed in Alamut® Visual demonstrating the presence of an FLT3-internal tandem duplication (c.1751_1786dup; p.R595_E596ins12) with a variant allele fraction (FLT3-internal tandem duplication/total) of 40% and a corresponding allelic ratio (FLT3-internal tandem duplication/wild type) of 0.7. FLT3-internal tandem duplication reads showed only partial alignment with the reference sequence and 5′ and 3′ soft-clipped bases (colored gray) flanking the duplicated wild-type sequence of the FLT3-internal tandem duplication (blue box). The 3′ soft-clipped bases mark the FLT3-internal tandem duplication insertion site and the FLT3-internal tandem duplication sequences. Red stars mark the wild-type reads with complete alignment with the reference sequence. Green, forward reads; blue, reverse reads. Note that the FLT3 coding reference sequence is in reverse complementary orientation to the next generation sequencing Binary Alignment Map alignment sequence

