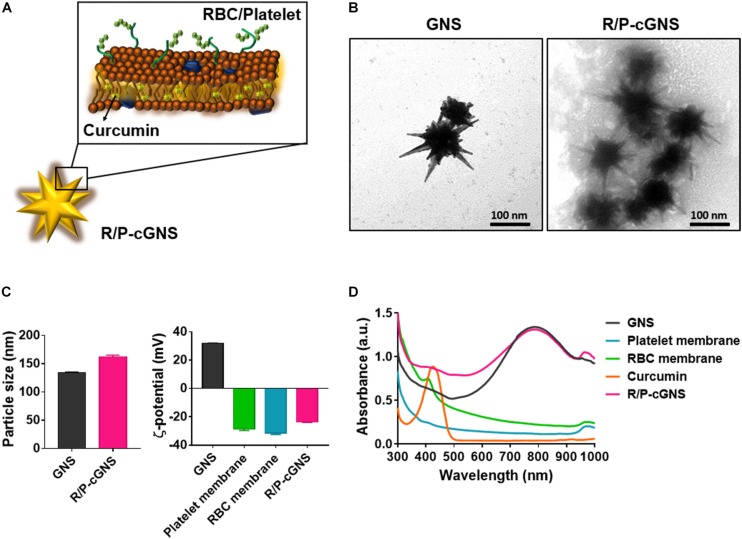
FIGURE 1.
(A) Schematic illustration of R/P-cGNS. (B) Representative transmission electron microscopy images of GNS and R/P-cGNS showing the membrane coating structure (scale bar, 100 nm). (C) Particle size and surface charge of GNS and R/P-GNS, before and after coating with blood cell membranes. Error bars represent the mean ± SD (n = 3). (D) UV-vis absorption spectroscopy of GNS (black), PLT membrane (blue), RBC membrane (green), free curcumin (orange), and R/P-cGNS (pink).

