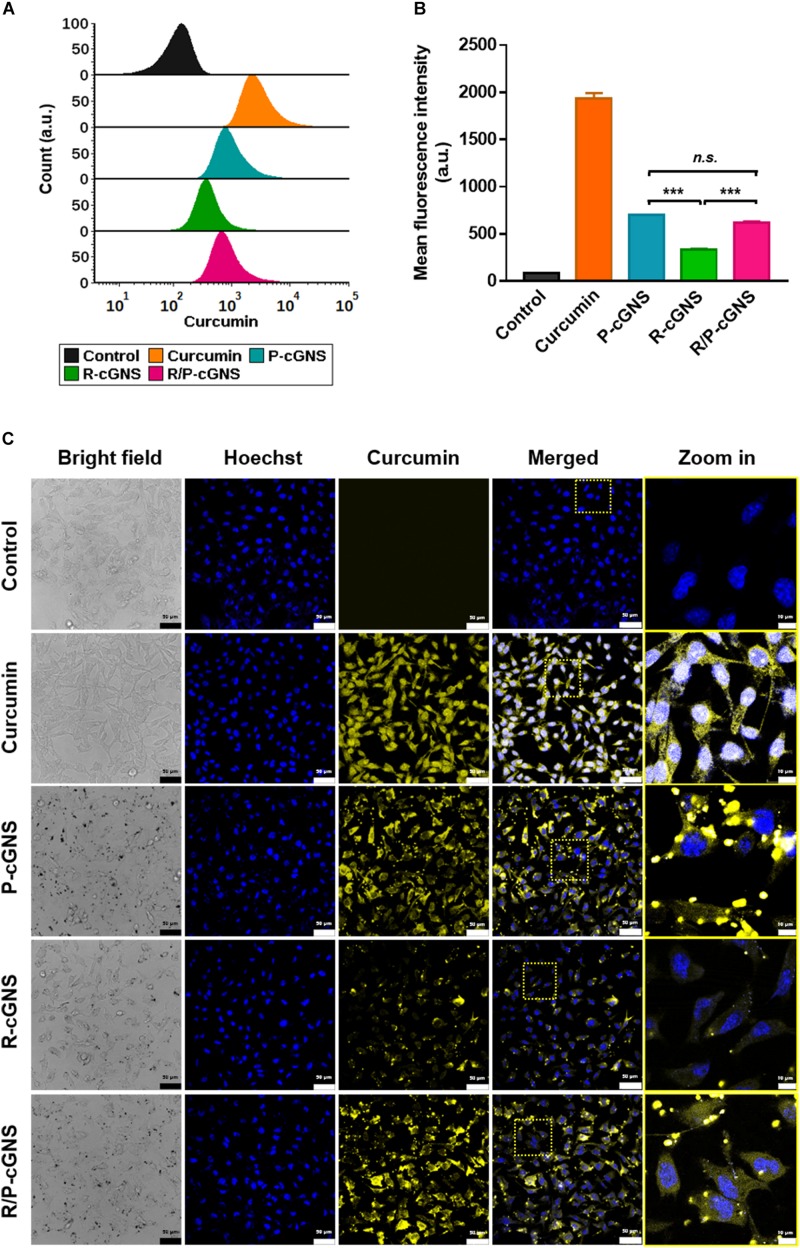
FIGURE 3.
(A) Histogram plots of the fluorescence intensities showing cellular uptake of curcumin (orange), P-cGNS (blue), R-cGNS (green), and R/P-cGNS (pink) at a concentration of 25 μM curcumin. (B) The mean fluorescence intensities of different curcumin treatment groups with regard to the background level of untreated cells (black). Error bars represent the mean ± SD (n = 3) (***p < 0.001 vs. R-cGNS; n.s., no significant difference, P-cGNS vs. R/P-cGNS). (C) Confocal images of different curcumin treatment groups in B16-BL6 cells.

