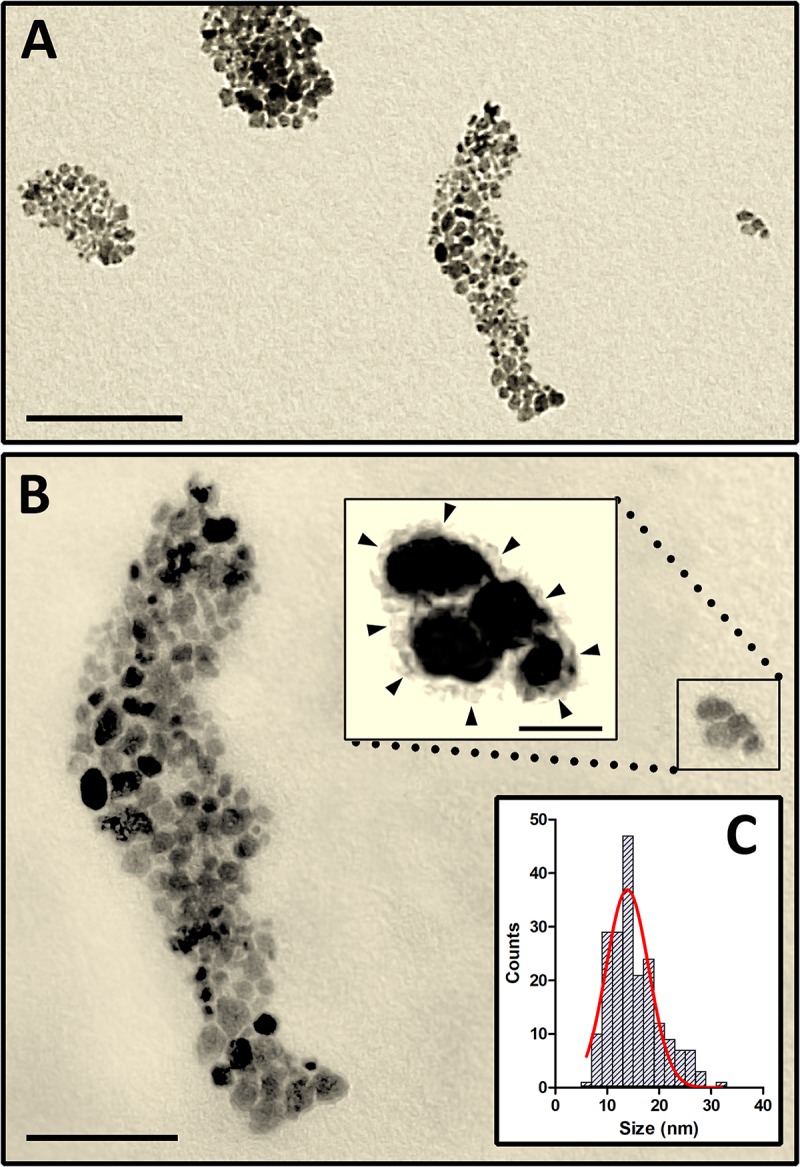
FIGURE 1.

High resolution TEM images showing aggregates of MNP-OCT in a diluted water suspension (A). (B) Is a higher power of the right half of (A). The inset is a higher power of the boxed area showing a small group of MNP-OCT. The brightness and contrast of this image were modified with Adobe Photoshop to visualize the organic coating surrounding the magnetite core (arrowheads). (C) Shows the histogram and the fitting Gaussian curve used to extract the average particle size. Scale bars, 200 nm in A; 100 nm in B; 20 nm in the inset.
