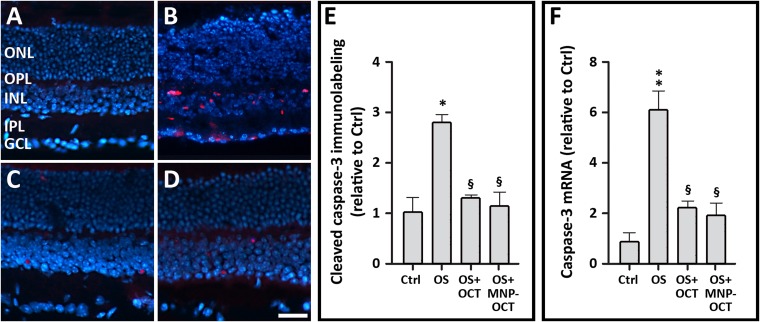
FIGURE 4.
Representative immunofluorescence images of cleaved caspase-3 in sections of retinal explants cultured in control conditions (A), in OS (B), in OS with 1 μM OCT (C) or in OS with 1 μM MNP-OCT (D). Retinal layers are visualized with DAPI counterstain. Scale bar, 50 μm. (E) Quantitative analysis of the number of cleaved caspase-3 immunopositive cells per unit length of retinal section. (F) Quantitative analysis of caspase-3 mRNA expression as evaluated with qPCR. Values are indicated as mean ± SEM. ∗p < 0.05 and ∗∗p < 0.01 vs. the respective Ctrl; §p < 0.05 vs. the respective OS; n = 3 both in (E,F). GCL, ganglion cell layer; INL, inner nuclear layer; IPL, inner plexiform layer; ONL, outer nuclear layer; OPL, outer plexiform layer.

