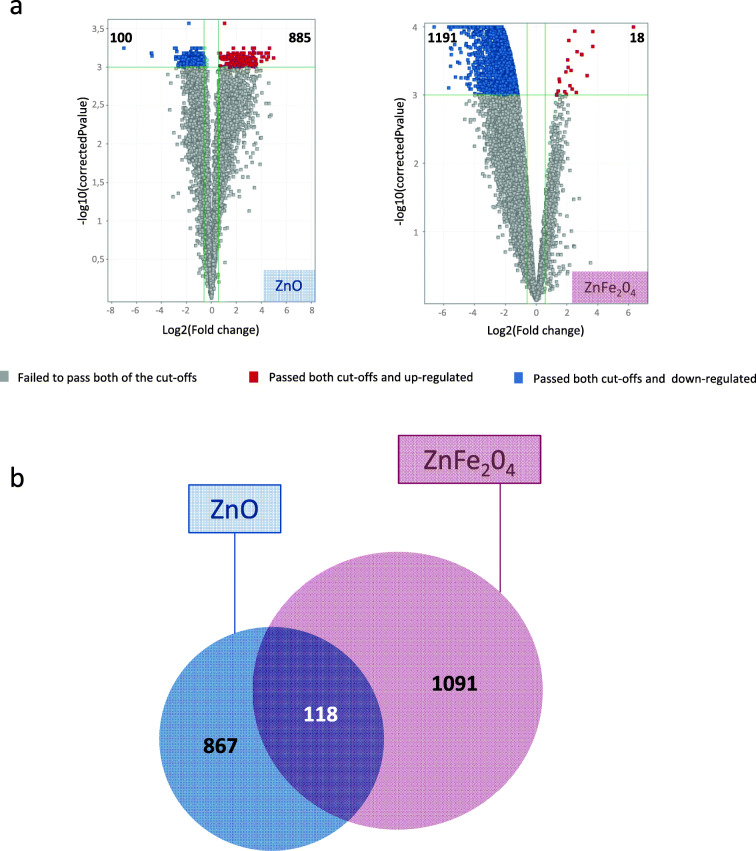
Fig. 3.
Differentially expressed genes (DEG) of NR8383 cells exposed to ¼ IC50 of ZnO and ZnFe2O3 NPs during 4 h. Two cutoffs were applied: statistical test Benjamini-Hochberg corrected at p value < 0.001 and fold changes > |1,5|. a Representative volcano plots of differentially overexpressed (in red) and downexpressed (in blue) genes, for each exposure condition. Numbers of DEG are indicated. b Venn diagram showing common differential gene expression between cells exposed to ZnO and ZnFe2O3 NPs

