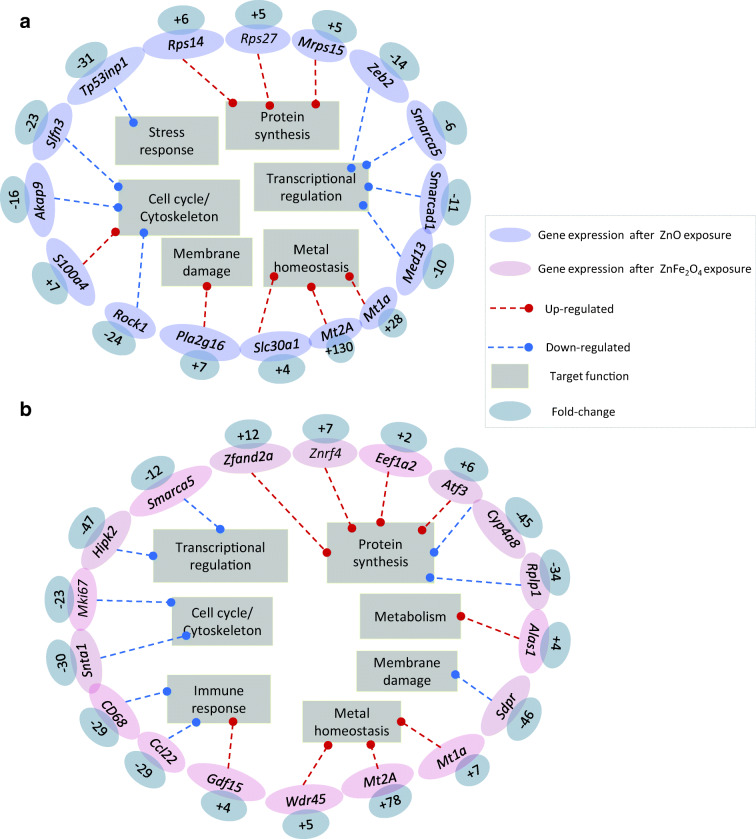
Fig. 5.
The main strongly deregulated genes in NR8383 cells exposed to ¼ IC50 of ZnO NPs (a) and ¼ IC50 of ZnFe2O4 NPs (b) during 4 h. Statistical test was Benjamini-Hochberg corrected at p value < 0.001. Both blue (a) and pink (b) colors are representing the ZnO and ZnFe2O4 NP deregulated genes. The fold change values are in the gray circles linked to the corresponding genes. The red and blue arrows indicate overexpression and underexpression of linked genes, respectively. Finally, the functions involved are arranged in rectangles

