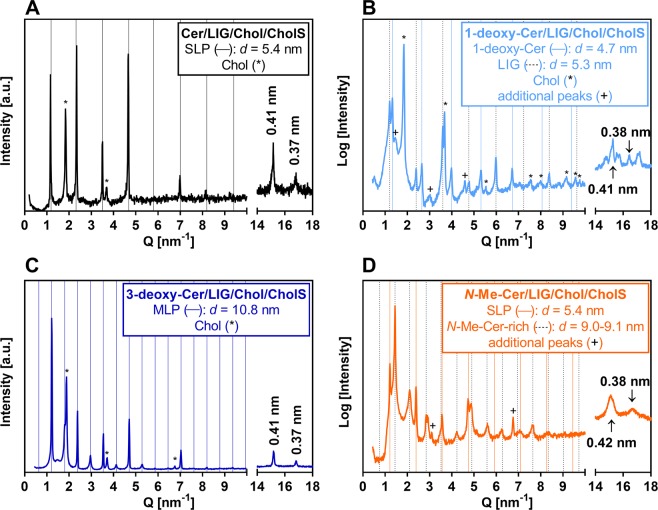
Figure 2.
XRD diffractograms of SC lipid models containing either Cer (panel A), or 1-deoxy-Cer (B), or 3-deoxy-Cer (C), or N-Me-Cer (D), along with LIG, Chol, and CholS. The intensity is given in arbitrary units (a. u.). Full and dashed grid lines predict the positions of SLP (panel A and D), MLP (panel C), and other structure reflections. Asterisks mark the separated Chol. The determined repeat distances are shown in the respective panels. The peaks at 0.41 nm and 0.37 nm in the wide-angle region (Q = 14–18 nm−1) indicate the orthorhombic packing of polymethylene lipid chains.

